Architecture plus1.wapstart.ru
Good day, community!
Initially, I planned to write an article in the form of a summary of a report on devconf . Then I realized that the forty-five-minute speech was difficult to put into an article on Habré, while leaving its size sane. Therefore, the article discusses the architecture plus1.wapstart.ru , and slides from the conference can be viewed here .
Plus1.wapstart.ru is an advertising network for the mobile Internet. Our “ecosystem” is advertisers, owners of sites (sites and applications) and audience of users.
Site owners want to monetize their audience as simply and efficiently as possible, advertisers want to invest money efficiently, advertising should not be annoying consumers, but at the most they should be satisfied with it.
Task plus1.wapstart.ru - meeting the needs of these groups. For us, their desires mean that we have to work as fast as possible, not allow a minute of dayout and, of course, monitor the quality and appearance of advertising.
')
Some numbers:
- Peak load> 10 3 dynamic requests per second.
- On the day we show more than ~ 10 7 ads.
- The total number of banners and sites is measured in four-digit numbers.
- The average return time of the banner does not exceed 90ms.
If you're wondering how it all works - welcome under the cut!
Iron

BY
We strive for uniformity:
- Fronts - freebsd , nginx .
- Farm (application server) - Debian GNU / Linux , php 5.3 fpm , onphp framework , memcached , its demons (we will tell about them in the next report).
- Database servers - Debian GNU / Linux, Postgres 9.0, replication out of the box.
- Serving servers - Debian GNU / Linux, zabbix , pinba .
How do we select a banner
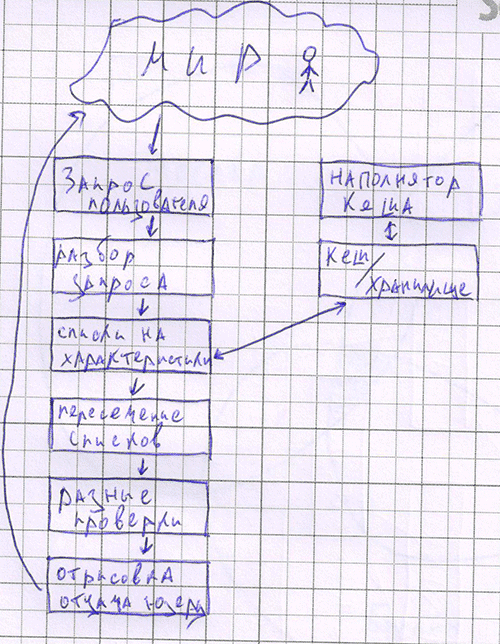
The main rule - if something can be counted in advance, it must be considered in advance.

The process itself looks like this:
- We parse the request (http) to display the banner. From fast storage
we get the characteristics of this request: we define the operator by ip
address, model and operating system of the phone by user-agent and others
headlines. - For each characteristic of the request, we get a list of banners,
suitable for this request. - Intersect lists.
- The resulting set of banners is checked by additional
"Checkers". This is because some checks can be done
only at runtime, because they are tied to a specific request.
For example, it makes no sense to show the banner to the user, if he already
I saw 10 times and did not click on it.
How do we count statistics

We must always be ready for growth. Processes should be laid in such a way that they can be easily parallelized.
It works like this:
- Each server writes statistical events (the fact of the show, the fact of the click, etc.) to a file in serialized form.
- The file name contains a timestamp.
- The file handler groups the records from the file, “collapsing” homogeneous events into one record, writes the resulting set into a temporary table in the database and archives the file.
- The temporary table contains a timestamp in the name. After its aggregation into watch tables, it is deleted (drop).
- Daily tables are constructed from hour tables, and monthly tables are constructed from day tables. The data in each type of table has a certain storage age.
Monitoring

Now we use zabbix as the main monitoring service. I can not say that it is fast, but on our set of triggers and servers it works quite well. Not only iron indicators (io, cpu, la) and application indicators (return time, logging process) are monitored, but also business metrics (trade secret :).
To collect real-time application statistics, we use pinba (I already wrote about it :)).
The most critical triggers come to us by sms.
Errors
Errors happen to all. Naturally, developers should be aware of errors, and it is desirable to learn about them before the user learns about them. We use syslog to collect errors, good php
knows how to log there. Data from syslog is aggregated on the server and once every N minutes is sent to the mailing list. This allows you to quickly catch problems.
On this, perhaps, you can finish. The dialogue can be continued in the comments. Our team will be happy to answer your questions.
ps. We share our experience with the community - https://github.com/Wapstart
pps. About how we "cheat" our applications will be a separate post.
Source: https://habr.com/ru/post/146520/
All Articles