Depth in Agile: Agile Evaluation Framework
Continuing to talk about the degree of immersion in Agile started here .
A logical continuation of the previous article will be the consideration of the Agile Evaluation Framework (abbreviated Agile: EF). In short, this is a framework for a detailed assessment of the depth of implementation (or degree of development) of certain practices. The key word here is "detailed" and "framework".
Developed Agile: EF the same Bill Krebs in collaboration with Per Kroll in 2008.
The meaning is:
- We take a questionnaire for any practices (the main thing is that according to the practices it was possible to give marks from 0 to 10)
- Interrogate the team
- Build a bar chart for each practice
- On the histogram we note the variability of the results (breadth of variation of opinions)
- Analyzing the histogram, discussing the team, formulate a plan of action
And now we will consider in detail.
Questionnaire
Agile: EF does not tell us which questionnaire to use, so this can easily be a questionnaire from Shodan Adherence Metrics or some kind of your own. This is both a plus and a minus of this assessment method, since There is an opportunity to come up with a questionnaire that you need at the moment and in this situation, but you can come up with a questionnaire that will not give us any useful information. But this must be tolerated, because This is not a specific assessment method, but a framework. Many recommend taking a Shodan questionnaire and modifying it depending on the practices or practices you use that you want to implement.
')
Poll
With the survey, everything is simple. Filled anonymously by each team member.
Providing results
According to the survey results we calculate:
- The average value for each practice
- The spread of values for each practice
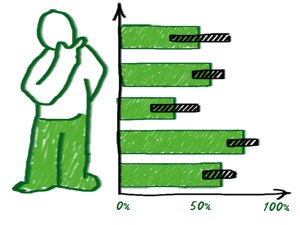
Then put the data on the histogram and get something like this:
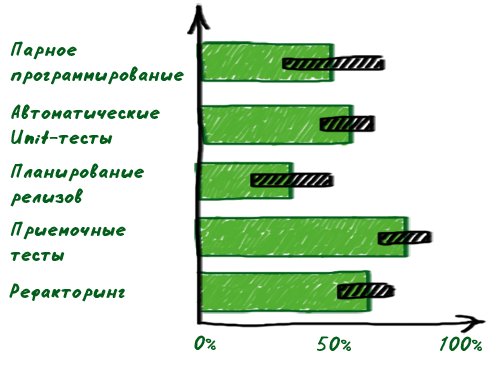
Vertically we postpone the practice, horizontally the degree of immersion (in percentage or points). Green blocks are the degree of immersion in a particular practice. Black blocks - the variability of parameters (you can use the minimum and maximum values, but if the number of participants in the survey is large, then it is better to calculate the standard deviation).
As you can see, everything is clear. Now you can discuss the indicators themselves and variability, draw conclusions, plan development.
Links
Source: https://habr.com/ru/post/146151/
All Articles