Profiling and debugging php applications using xhprof & FirePHP

All web developers, especially in high-load projects, sooner or later have to deal with the profiling of their applications. Of course, we all know xdebug, with which you can debug the server side. However, in heavy RIA-applications, it is much more often necessary to be debugged in the frontend + backend bundle, all sorts of ajax-requests, the speed of working out specific scripts and all that jazz. And for these tasks there is a rather not bad set of tools. This is xhprof and firephp.
Quick reference
xhprof is a php extension from facebook. This is a hierarchical profiler that allows you to collect such statistics as the execution time of each function, memory usage, waiting time, number of calls and more. This extension is available from the PECL repository: http://pecl.php.net/package/xhprof . You can read the documentation here: http://php.net/xhprof .
FirePHP is an extension for firebug, which, in conjunction with its small php class, allows you to transmit data from php to the firebug console, for example, all sorts of var_dump and other debugging information. The main advantage of this extension is that the entire translation of debug information occurs through the headers and does not litter the pages and generally does not break the logic of the application. Official site: http://firephp.org/ .
Main idea.
The general profiling algorithm is as follows:
- At the top of the page, enable profiling with xhprof_enable ()
- At the end of the page, turn off profiling with xhprof_disable () and save the collected data with save_run ()
- Next, using the php-class firephp, we transfer the link to the profiling data to the client part
- In the firebug console, we open the information we need.
- We are happy :)
I also want to say that, of course, manually adding these functions to your php scripts is great. But I want this information to be always at hand during development, and at the same time not to get to the combat servers. We solve this problem as follows:
')
In our projects, in almost all the scripts in the beginning, the working file is connected with the class loader, the connection of functions and other necessary things. Therefore, we included profiling into this file. And in order to be able to turn on / off the debugging mode, they added a check for the configuration constant at will, plus they wrapped these checks into certain meta tags, which were automatically deleted when the project was built. The same applies to turning off profiling and writing information to headers using firephp - these tasks are solved by one function, which is called at the end of each php script and is also wrapped in meta tags. It looks like this:
// -

/** * */
define( "APPLICATION_ENV" , "dev" ); // dev - | pro -
/** */
define( "XHPROF_ROOT" , __DIR__ . '/ExtProcs/debug/xhprof-0.9.2' );

/***************************************************************************************
* ,
* DEV_START DEV_END - -,
***************************************************************************************/

//-- DEV_START
//-- debug
if (APPLICATION_ENV === 'dev' ) {
// firephp
require_once(__DIR__ . '/includes/ExtProcs/debug/firephp/FirePHP.class.php' );
//--
require_once (XHPROF_ROOT . '/xhprof_lib/utils/xhprof_lib.php' );
require_once (XHPROF_ROOT . '/xhprof_lib/utils/xhprof_runs.php' );
// .
// php.net/manual/ru/xhprof.constants.php
xhprof_enable(XHPROF_FLAGS_CPU + XHPROF_FLAGS_MEMORY);
}
//-- DEV_END

//
// DEV_START DEV_END

/**
*
*/
function dev_boot_Down() {
if (APPLICATION_ENV === 'dev' ) {
// firephp
$firephp = FirePHP::getInstance( true );
//
$xhprof_data = xhprof_disable();
$xhprof_runs = new XHProfRuns_Default();
$run_id = $xhprof_runs->save_run($xhprof_data, "xhprof_testing" );
//
$link = "http://" . $_SERVER[ 'HTTP_HOST' ] . "/includes/ExtProcs/debug/xhprof-0.9.2/xhprof_html/index.php?run={$run_id}&source=xhprof_testing\n" ;
$firephp->info($link, 'profiling data' );
}
}

* This source code was highlighted with Source Code Highlighter .
I will not go into the details of installing these extensions, because everything is simple. I can only say about some of the settings. There is only one configuration variable in xhproof - xhprof.output_dir, which points to the folder where the profiling data will be saved. Therefore, make sure that the user in the specified directory, from which the PHP scripts are executed, has write access. So write something like this into your php.ini:
[xhprof]
extension=xhprof.so
xhprof.output_dir="/var/tmp/xhprof"
It is also not bad to put something like dot or Graphviz for drawing call graphs. I have Graphviz on MacOS X.
Having done the above procedures, we were able at any time, right in the browser, to open and look at the profiling of any of our scripts.
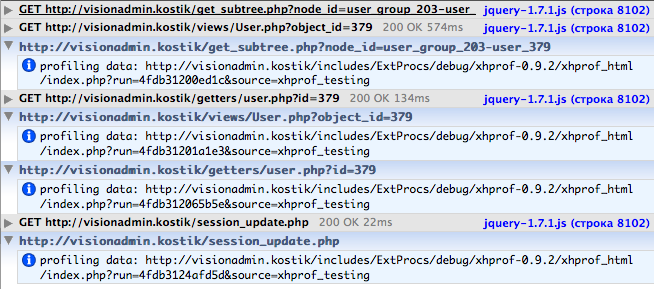
By copying and opening the link to the profiling data, you can see something similar to this. The number of columns with values depends on the flags specified in xhprof_enable ().

And if you follow the link [View Full Callgraph], you will see the call graph of the functions of our script.

Well, on this, perhaps, that's all. If someone has their own approaches to debugging and profiling web applications, I will gladly listen.
PS I will only add that comrade kryapolov was actively involved in all this disgrace
UPD 1: For Pythonists there is such a project as FirePy , which, however difficult to guess, allows you to translate data from a python into a firebug.
Source: https://habr.com/ru/post/145895/
All Articles