Clustering on the client or how to show 10,000 points on the map
 There are several types of projects
for which geo-information output is
necessary: real estate sites, company catalogs,
catalogs of attractions, bulletin boards and others.
For these sites, I decided to develop a plugin for goolge API 3 and Yandex API 2.
Primary requirements:
- The ability to connect without deep data preparation on the server, namely, using only the already existing geographical coordinates of the objects.
- Simple protocol preparation and transmission of data.
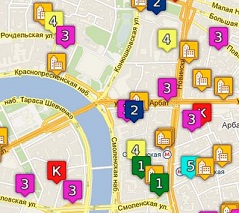
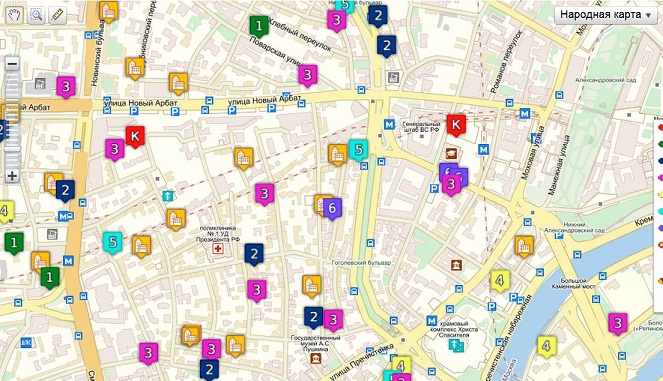
- Fast client clusteriser with TWO tag types: cluster and group. Cluster - several objects located nearby. When clicked, the cluster “expands”, that is, increases the zoom while objects are at a distance greater than the clustering distance. Group - several objects at one point (at the minimum distance). When clicking on a group on any zoom, a list of objects in the group is displayed.
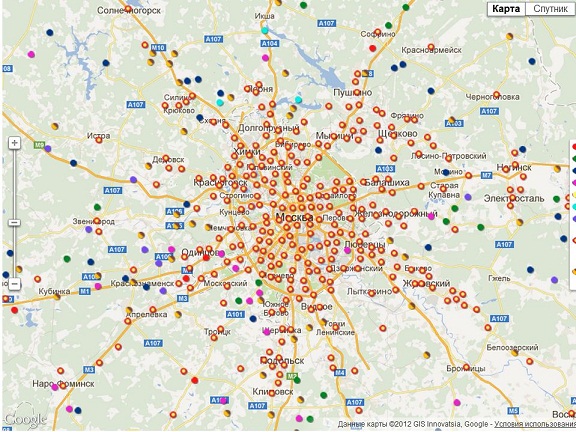
- Displays up to 10,000 points using a clustering device.
- Display in ie7, on mobile devices (first-generation iPad).
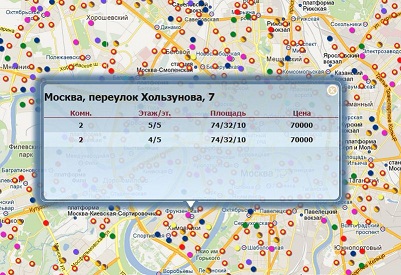
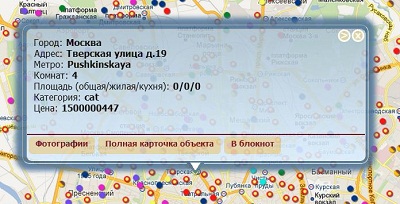
- Templating on the client of two info-windows - a group cluster and the object itself.
- Use sprite for tags.
- The ability to use an unlimited number of types of labels (icons) for different types of objects.
- Ability to use multiple icon sizes for a different zoom range.
In the article I will describe several approaches that were used to implement this plugin.
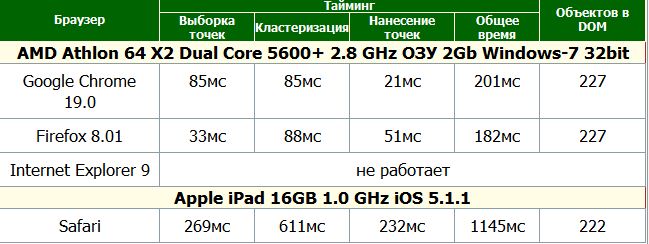
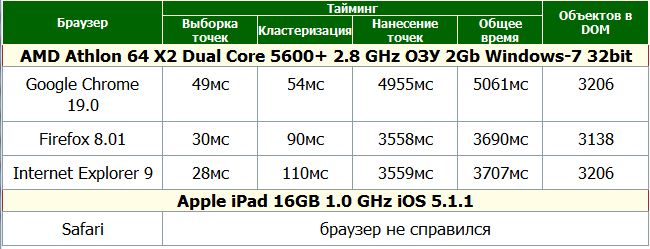
Measurement of the operation time of the functions was carried out on several devices. For convenience, I will write in a fraction of 2 of them - Google Chrome 19.0 @ AMD Athlon 64 X2 Dual Core 5600+ 2.8 GHz 2Gb RAM Windows-7 32bit as the average and Safari @ Apple iPad 16GB 1.0 GHz iOS 5.1.1 as the slowest and most capricious .
Server part
The server part consists of two requests:
')
1. Request for card data.
A link with parameters for selecting tags is passed to this request. For example,? City = 1 & rooms = 1,2. That is, we select only the city id = 1 with 1 and 2-bedroom apartments (an example for a real estate site).
In response, a script with json-parameters of the map (type of map, center and zoom of the map, parameters of icons, clustering distance, sprite, etc.) and json are given with data on all points. The data points contain: object id, geo-coordinates, icon type, and tooltip string. At 10,000 points in the uncompressed state, the response size is 1.2 MB, but when gzip is compressed, it is only 350 kb.
Frequently repeated requests are well cached by nginx.
2. Request for an object.
When you click on a single marker, an information window pops up with information about the object. Ajax request contains the object id. In response, json is given. The json field names must match the tags in the info window template, the latter are replaced with the received content.
Client part
Parsing data about points
The data obtained is processed as follows:
1. Calculate the global pixel coordinates on the zero zoom for each point.
2. Based on the global coordinates, the id of the tile is calculated on the 14th zoom, and the points are placed in an array with the corresponding id of the tile. In the future, on any zoom you can easily calculate the Id of the required tiles and select all points for them. Point sampling rate - for 10,000 points, no more than 100 / 350ms.
The parsing time is 10,000 points - 100/650 ms
Clustering machine
I have tested several clusterizers, including the native Clusterer from Yandex API 2. None of them suit me for several reasons. First, in all there is only a cluster, there is no group. After clicking on the cluster, the zoom will increase to the maximum, but the list will not appear. You must click again to get the list. That is how Clusterer works from Yandex. MarkerClusterer for Google Maps v3 also does not have this type of marker.
Secondly, the clusters are calculated on the grid, which, although quickly, but clusters with a large number of labels are located “on the grid”, and it looks ugly.
As a result, our own clusterizer Clusterize was written. It has an asynchronous hybrid clustering method: when requesting data for a tile, the following occurs:
- the tile is divided into 4 sub-files (grid) and each sub-tile is clustered by distance, but the cluster itself is not located in the middle of the cell, but in the center of the area of the “collapsed” points.
- The resulting points and clusters are collected back into the tile, and are again clustered. At this stage there are already a few points.
- obtained points are “punctured” taking into account the adjacent tiles (if they have already been clustered). That is, if there is a cluster or marker in the adjacent tile on the border that overlaps the marker on our tag, then these markers are combined into a cluster. By this we achieve the absence of “sticking” of markers on the borders of the tiles.
The clustering rate turned out to be quite high: from 10,000 we get 580 points in 60 / 500ms. It is quite acceptable.
Marker Icons
To display icons, I use a sprite. The number of types of icons is not limited. The examples use 7 types of icons for single markers + cluster and group icons. Each type of icon in Example 2 of two options — a large one for the zoom is over 14 and a small one for less than 14. Since the clustering distance is 17 pixels, for small scales, small icons look nicer.
Information Templates
By clicking on the marker occurs:
1. If the marker is a cluster - the cluster is zoomed up to “disclosure”.
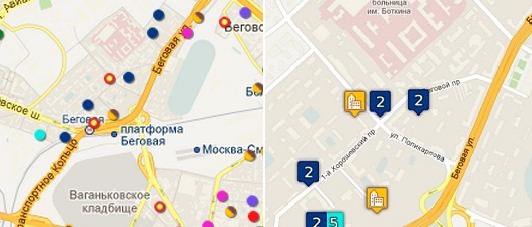
2. If the marker is a group, a list of objects from this group is displayed:
3. A single marker loads the data and displays the info window.
Output markers.
To display the markers, I used Google API 3 and Yandex API 2.
A model was written in which I store and process data, cluster tiles and draw canvas, as well as several controllers that load the necessary API and draw markers.
Google API 3 - Native Controller
The controller uses the native functions of Google Api 3 and the clusterizer Clusterize.
Google API 3 loads quickly, uses canvas whenever possible, and supports sprites for labels.
Example
Virtues
A small amount of code
Auto switch to CANVAS
Sprite support
disadvantages
Slow and clumsy drawing when changing zoom
In ie, 4 objects are created for each marker; on the zoom 10-12, ie, the DOM crashes.
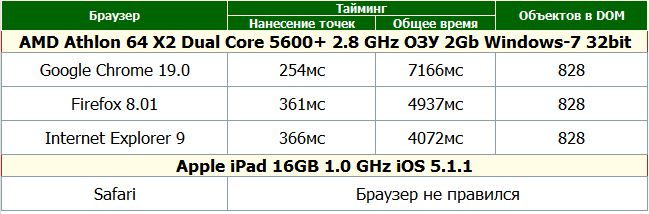
Output rate of 10 zoom cards with 10,000 points and clustering

Google API 3 - canvas controller
The controller uses canvas to render each tile and the clusterizer Clusterize.
In this controller, tiles are rendered on the canvas asynchronously. It has no particular advantages over native functions, except for a small gain in drawing speed.
Example
Virtues
A small number of DOM objects
Higher rendering speeds up to 50% compared to the native controller
Sprite support
disadvantages
Flashing when changing zoom
Not supported in ie
Output rate of 10 zoom cards with 10,000 points and clustering
Google API 3 - fullcanvas controller
The controller uses canvas to render the entire visible part of the map.
Clusterize clustering.
The canvas is used to match the size of the visible part of the map and is drawn with each movement.
Example
Virtues
The smallest number of DOM objects
Highest rendering speed up to 100% compared to the native controller
Sprite support
FlashCanvas support for ie 6>
Beautiful animation when changing zoom
disadvantages
In ie, it works only with a page scale of 100% (bug)
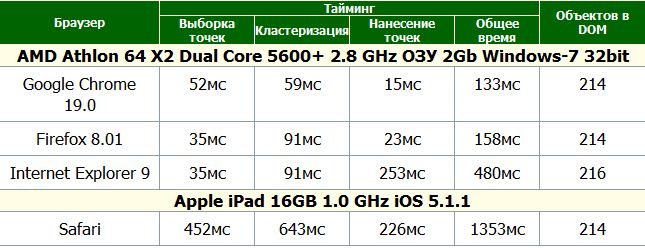
Output rate of 10 zoom cards with 10,000 points and clustering

Yandex API 2 - native controller "out of the box"
The controller uses API 2 out-of-box features.
Clusterizer is also a native Clusterer.
In the new Yandex API 2, the clusterizer is already built into api as a module. Cluster use - 3 lines of code. There is a configuration of icons of clusters and a info window with a list. In this example, I did not use this, so the processing time is simply catastrophic.
Example (output may take a long time!)
Virtues
All functions are out of the box.
disadvantages
Very slow initial processing and clustering.
A huge number of DOM objects
No cluster type "point"
Lack of support for the sprite.
Flashing when changing zoom
Output rate of 10 zoom cards with 10,000 points and clustering
Yandex API 2 - native controller
The controller uses API 2 functions to host the GeoObject.
Use software templates for labels and clustering Clusterize.
I rewrote this controller several times. ymaps.GeoObject currently does not support sprites, and the overlay.staticGraphics.Placemark factory does not support shadows. As a result, I made my layout template for markers, which consists of 2 divs - an icon and its shadow.
Example
Virtues
Enough high speed card preparation
Sprite support via layout tags
disadvantages
A huge number of DOM objects
Slow
Kills ie
Output rate of 10 zoom cards with 10,000 points and clustering
Yandex API 2 - canvas controller
The controller uses canvas to render each tile and the clusterizer Clusterize.
Uses the same render as Google canvas. Unlike the Googe API, where the channels were animated smoothly when the zoom was changed, I could not achieve this from Yandex API 2, although I already know how to do this (with a crutch).
Example
Virtues
A small number of DOM objects
High rendering speed
Sprite support
Smoothed Motion Effects
disadvantages
"Porridge" when changing the zoom
Not supported in ie
Output rate of 10 zoom cards with 10,000 points and clustering

Yandex API 2 - fullcanvas controller
The controller uses canvas to render the entire visible part of the map.
Rendering is done every time you move the map and change the zoom.
Clusterize clustering.
Unlike the Google fullcanvas controller, here the canvas is wider and taller than the viewing area. Therefore, moving the map is smoother. Animation when changing the zoom had to write independently.
Example
Virtues
The smallest number of DOM objects
Highest rendering speed
Sprite support
FlashCanvas support for ie 6>
Beautiful animation when changing zoom
disadvantages
In ie, it works only with a page scale of 100% (bug)
Output rate of 10 zoom cards with 10,000 points and clustering
Acting examples you can see here.
Conclusion.
Using fullcanvas controllers is most effective. For ie, FlashCanvas is applicable, albeit with restrictions.
Moreover, the fullcanvas controller is an excellent opportunity to use WebGL to animate markers (for example, 3d turn behind the cursor), to create other animation effects.
Templates for the info window allow you to customize the design for any project, as well as display any information about the object.
To date, the plugin is written at 95%. It remains to pick up some bugs, as well as optimize the rendering of canvas in fullcanvas controllers.
The only unsolved problem so far is the page scale for FlashCanvas in ie. I think in the near future and it will be able to overcome.
Source: https://habr.com/ru/post/145832/
All Articles