How we did the map services
“One of the most promising technologies of social communications is geolocation services (Location-based services - LBS), which allow to determine the location of a user / mobile subscriber.
CNews (For more information: www.cnews.ru/reviews/index.shtml?2012/06/06/492022 ”)
The Mediagates team fully shares this view. Therefore, today we want to tell Habrasoobschestvuyu how we developed geolocation services for our project - Mediagates.ru . The post includes the choice of a map service, a description of the tasks, difficulties and algorithms for solving.

')
To make it clear what this is all about, first a few words about the project. The main task of "Mediagates" is to unite professionals in the field of music: artists, producers, promoters, platforms and others. In more detail about the possibilities of the project, as well as its architecture, we will tell in the next posts here on Habré. In the meantime, you can read the post about the project on our website.
Even at the design stage of the site, we realized that for a more visual presentation of information, you just need to use maps. They make it possible to quickly find artists nearby or correctly advertise themselves using geo-targeting. And now we invite everyone habrovchan on a beta test. The fact that you can potestit, later in this article.
Our main and most important requirement was the maximum possible penetration of interactive and static maps on most pages of the project. After studying the structure of our site, we came to the conclusion that it is necessary to have several basic modules that we can place in different sections of the project:
For more information about the capabilities of the cards on Mediagates.ru, you can read in the article " Everything to the card " posted on our website blog, and here we would like to talk about the technical aspects of the implementation of services.
Of course, you will say that each of these points separately is relatively simple and obvious in implementation. But we suggest to go deep into each of them, to understand how all of them can be combined in one project, and to deal with all the difficulties and pitfalls that we had to face during implementation. Let's start with a very important decision: the choice of a map service.
I think you should not go into details, because Habré has many articles and reviews on this topic. The main problem we faced here was that in the process of designing our service, the Google Maps API became paid. We were afraid that this could spoil our plans, but after repeated detailed calculations, we were left with our decision to use the Google product.
The map services we reviewed:
The final analysis took place in early February 2012, the situation could have changed since then, but the selection parameters were as follows:
General impressions of the comparison were as follows:
As a result, we realized that at the moment we are most comfortable with the Google Maps API, despite its payment, but in the future it is possible that we will have to switch to another map service. In this regard, it was decided to organize our code so that it was possible at any time to add classes to work with another map service, without the need to rewrite the main part of the work with maps. In other words, they decided to divide the task into two subtasks: interactive on the site and communication with the map service.
Google bribed us with a very good geocoding service (Google Geocoding API). To be honest, our developers had a chance to actually see the joke that exists in the professional community “Yandex - There is everything. Google - Nothing was lost. ”: The Google Geocoding API manages to find the location of very, very many addresses, without requiring the user to enter it in the original language.
Among the shortcomings of the Google service, it is worth emphasizing once again the weak “knowledge” of Russia and payment (in case of exceeding the limit on accessing the API and initialization of maps). So far, we have had to abandon the customization of cards due to the reduction of limits on the initialization of customized maps.
So the service provider selected is Google. So at our disposal were:
Now we offer to deal with the general architecture of the front-end and back-end. Let's start with the front-end.
As we have said, we wanted to be able in the future to quickly add the opportunity to work with another supplier of cards. Therefore, we have developed fundamental classes, which are, in fact, an extension of such classes as:
For markers, we needed an additional opportunity to display names and pop-up lists (for example, for groups of markers). We decided to take the Gary Little MarkerWithLabel for V3 class and modify it to suit our needs.
We also prepared the main classes for working with modules:
The back-end was supposed to perform the following main tasks:
Here, first of all, you should pay attention to the grouping of markers, then we will consider the process of combining curve markers, and at the end - exporting maps.
The need for grouping markers occurs when you have to work with a large number of objects on the map. Some browsers start the brakes with the processing of several dozen non-standard markers. To avoid this, it is necessary to combine the objects on the map into groups.
Grouping is of two types: front-end and back-end. The first is implemented in Java Script, the second - in the server language. For Java Script grouping, there are quite a few ready-made engines that could be used, but transferring such a large amount of data from the server to the browser, the work is also ungrateful - the more data, the slower the browser will be to think that, as a result, it will decrease speed of work with the site and the deterioration of perception of information.
After we stopped at the server-side grouping of markers, we began to wonder what algorithms were already invented in this area. It is customary to talk about the two most common types of clustering: grid-based and distance-based. The first option is simpler, the second is steeper in terms of algorithm and implementation. We have taken the first path for a quick start, but we are already working on distance-based clustering, which we plan to implement in the near future.
The essence of the grid-based grouping is simple: for each approximation (zoom), the globe is divided into shapes (relatively speaking, rectangles), which are groups. In other words, if more than one object immediately falls into any of these figures, they are grouped into one marker, symbolizing the group.
Initially, we thought to make a simple polyline, which will combine in a chronological order certain markers or groups of markers on the map. It is clear that this is most conveniently done using the google.maps.Polyline and google.maps.PolylineOptions classes. But first, our GUI designers, and then the programmers decided that it would be much more beautiful to have not a broken line, but a smooth (as far as point-based construction allows) curve, which will combine the markers of our users.
As in the case of grouping, we decided to design this curve on the server side in order not to overload the user's computer. After some short tests, we stopped at the interpolation method with cubic splines, the result of which is transferred from the server to JavaScript, which already draws it point by point using google.maps.Polyline.
Let us dwell on the algorithm. From the point of view of mathematics, he is nothing complicated. In PHP, we made the following classes:
The following are minimized for understanding the source code of each of these classes.
Point.inc
Cubic.inc
Poly.inc
And here is the process of building our curves for arbitrary points. At the input we have a named $ points array with pairs of x and y values of each point.
At the output we have an array with coordinates for plotting a curve by points. Here is a visualized example of what happened:
And by changing a few settings, you can create an improvisation on the theme “HabraHabr Logo”:

In the near future, we plan to slightly refine our curves so that they are not just a line, but small arrows that show direction.
But now we believe that we gave artists, producers and organizers a convenient and beautiful way to tell everyone around what they do, what events they take part in as organizers or performers and where they are going to be at one time or another.
After the user plans his tour on the map and calendar, he will certainly want to notify his friends on social networks or publish this information on his blog. To do this, we made it possible to save the current map view with all the markers on the user's computer in JPG format.
We implemented it like this: when you click on the “Save as JPG” button, Java Script sends all the information about the current map view and markers on it to the server, which loads the required map piece using the Google Static Maps API, saves markers on it and temporary storage file, a link to which is returned to the user in the browser.
It would seem that nothing complicated: the main thing that should not be done is to try to place markers on the map on your own after uploading the image from the Google Static Maps API - nothing good will come of it. The solution is much simpler: the API allows you to place external images when you specify their coordinates on the map.
Here, one question remained open for us: how would you like to post a card on the user's wall on fb.com or vk.com? We cannot say that we studied the problem in detail, but nothing better than exporting the map to jpg image, and then manually publishing it on the wall, we did not invent. I would be happy if you tell me any way to publish a large image in the background. At the same time, we must understand that this image does not fit the concept of user-generated, which allows you to post a large size on Facebook.
In conclusion, we would like to add a few words about the search for objects on the map. When we thought about this function, we tried to combine the convenience of a graphical interface and getting the most relevant results. From the point of view of the UI, I always liked the search on afisha.ru very much - you enter everything you like, and he himself tells you what is on the site by this request and sorts by content types.
As a result, we used the search engine (or server, as it is sometimes called) sphinx, on which the main search on our site is based. With it, we get the most relevant data on user request from the database. Also, in case the user wants to find an address, we make a request to the Google Geocoding API.
Search results by database and addresses are displayed sorted by type after the first three characters entered by the user and make it possible by clicking on them to quickly move to the place on the map where this object is located.
In general, perhaps, and everything that we would like to tell on this issue. We are, of course, very interested in how habrayuzer will relate to the project, to the cards, in particular, and whether we survive the habraeffect. So welcome, register, check, test. Those who help with tips on exporting a card to Facebook and VKontakte will be very grateful.
CNews (For more information: www.cnews.ru/reviews/index.shtml?2012/06/06/492022 ”)
The Mediagates team fully shares this view. Therefore, today we want to tell Habrasoobschestvuyu how we developed geolocation services for our project - Mediagates.ru . The post includes the choice of a map service, a description of the tasks, difficulties and algorithms for solving.
')
About Mediagates.ru
To make it clear what this is all about, first a few words about the project. The main task of "Mediagates" is to unite professionals in the field of music: artists, producers, promoters, platforms and others. In more detail about the possibilities of the project, as well as its architecture, we will tell in the next posts here on Habré. In the meantime, you can read the post about the project on our website.
Even at the design stage of the site, we realized that for a more visual presentation of information, you just need to use maps. They make it possible to quickly find artists nearby or correctly advertise themselves using geo-targeting. And now we invite everyone habrovchan on a beta test. The fact that you can potestit, later in this article.
Main tasks
Our main and most important requirement was the maximum possible penetration of interactive and static maps on most pages of the project. After studying the structure of our site, we came to the conclusion that it is necessary to have several basic modules that we can place in different sections of the project:
- Interactive map with the ability to display on it certain types of markers (events, artists, promoters, sites, shops, etc.) and filter them by date;
- Tour Planner, which would allow the artists to plan their performances and movements on the map or on the big calendar, offer themselves to various sites and receive offers of joint performances from other users;
- The form for editing the location of an object so that all the content on the site can be tied to a map (for example, for the user it is a kind of check-in function);
- Static maps with markers on them to illustrate objects in the lists (otherwise you would have to initialize dozens of maps on each page, which would be costly both in terms of performance and the limits of map services). Also, static maps were needed to export the tour planner to an image in JPG format.
For more information about the capabilities of the cards on Mediagates.ru, you can read in the article " Everything to the card " posted on our website blog, and here we would like to talk about the technical aspects of the implementation of services.
Of course, you will say that each of these points separately is relatively simple and obvious in implementation. But we suggest to go deep into each of them, to understand how all of them can be combined in one project, and to deal with all the difficulties and pitfalls that we had to face during implementation. Let's start with a very important decision: the choice of a map service.
Choosing a map service
I think you should not go into details, because Habré has many articles and reviews on this topic. The main problem we faced here was that in the process of designing our service, the Google Maps API became paid. We were afraid that this could spoil our plans, but after repeated detailed calculations, we were left with our decision to use the Google product.
The map services we reviewed:
- Google maps
- Yandex maps,
- Cloud Made (or Open Street Map),
- Bing
- API 2GIS.
The final analysis took place in early February 2012, the situation could have changed since then, but the selection parameters were as follows:
- The quality of the drawing of the city of Yeisk (at the initial stage of the development of the project, it is important for us that the Russian Federation be drawn in sufficient detail),
- Drawing maps around the world (we have ambitious plans for the future)
- Willingness to customize the appearance of the cards (as a result refused from it),
- Legal restrictions on the number of initialization of maps or requests to a particular API,
- The quality of geocoding (including in the Russian Federation).
General impressions of the comparison were as follows:
- OpenStreetMap turned out to be the most detailed around the world, but they have not the best Geocoding API;
- The level of drawing of Madrid (the capital of Spain) on Yandex Maps leaves much to be desired;
- Bing poorly prepared for the Russian Federation;
- API 2GIS have a good start - I hope that in the future the guys will compete with the main players in this market;
- Google Maps gives the awesome Geocoding API, although the detail of some cities in the Russian Federation suffers, which is not the case with Europe (he himself used their maps many times to navigate cities with iPad instead of navigator). Google pay
As a result, we realized that at the moment we are most comfortable with the Google Maps API, despite its payment, but in the future it is possible that we will have to switch to another map service. In this regard, it was decided to organize our code so that it was possible at any time to add classes to work with another map service, without the need to rewrite the main part of the work with maps. In other words, they decided to divide the task into two subtasks: interactive on the site and communication with the map service.
Google bribed us with a very good geocoding service (Google Geocoding API). To be honest, our developers had a chance to actually see the joke that exists in the professional community “Yandex - There is everything. Google - Nothing was lost. ”: The Google Geocoding API manages to find the location of very, very many addresses, without requiring the user to enter it in the original language.
Among the shortcomings of the Google service, it is worth emphasizing once again the weak “knowledge” of Russia and payment (in case of exceeding the limit on accessing the API and initialization of maps). So far, we have had to abandon the customization of cards due to the reduction of limits on the initialization of customized maps.
So the service provider selected is Google. So at our disposal were:
- Google Maps API v3,
- Google Geocoding API v3,
- Google Static Maps API v2.
Now we offer to deal with the general architecture of the front-end and back-end. Let's start with the front-end.
The main components of the front-end
As we have said, we wanted to be able in the future to quickly add the opportunity to work with another supplier of cards. Therefore, we have developed fundamental classes, which are, in fact, an extension of such classes as:
- google.maps.Map,
- google.maps.Marker,
- google.maps.Geocoder.
For markers, we needed an additional opportunity to display names and pop-up lists (for example, for groups of markers). We decided to take the Gary Little MarkerWithLabel for V3 class and modify it to suit our needs.
We also prepared the main classes for working with modules:
- interactive map with filters of different types of markers and a small calendar (in one lane),
- tour planner, which is built on the first class, replacing the small calendar with a larger one (of course, expanding its functionality),
- indication of the location of the object.
The main components of the back-end
The back-end was supposed to perform the following main tasks:
- Selection from the database of a large number of markers that meet the conditions of the request from the front-end and their grouping;
- Generating static maps for displaying items in lists and exporting the current map view in the tour planner to jpg image;
- Combining markers (or groups of markers) of user events with a continuous curve.
Here, first of all, you should pay attention to the grouping of markers, then we will consider the process of combining curve markers, and at the end - exporting maps.
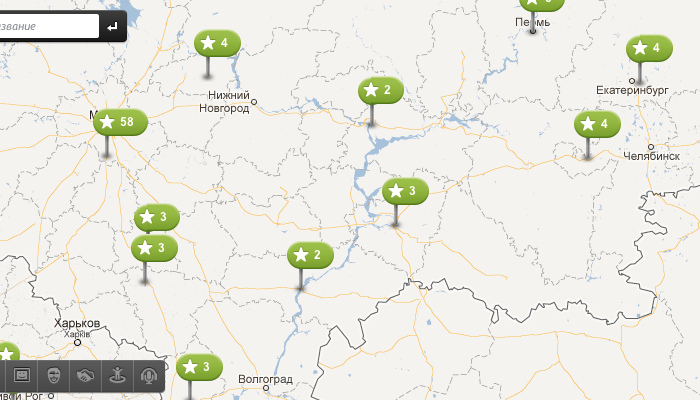
Marker grouping
The need for grouping markers occurs when you have to work with a large number of objects on the map. Some browsers start the brakes with the processing of several dozen non-standard markers. To avoid this, it is necessary to combine the objects on the map into groups.
Grouping is of two types: front-end and back-end. The first is implemented in Java Script, the second - in the server language. For Java Script grouping, there are quite a few ready-made engines that could be used, but transferring such a large amount of data from the server to the browser, the work is also ungrateful - the more data, the slower the browser will be to think that, as a result, it will decrease speed of work with the site and the deterioration of perception of information.
Server-side grouping of markers
After we stopped at the server-side grouping of markers, we began to wonder what algorithms were already invented in this area. It is customary to talk about the two most common types of clustering: grid-based and distance-based. The first option is simpler, the second is steeper in terms of algorithm and implementation. We have taken the first path for a quick start, but we are already working on distance-based clustering, which we plan to implement in the near future.
The essence of the grid-based grouping is simple: for each approximation (zoom), the globe is divided into shapes (relatively speaking, rectangles), which are groups. In other words, if more than one object immediately falls into any of these figures, they are grouped into one marker, symbolizing the group.
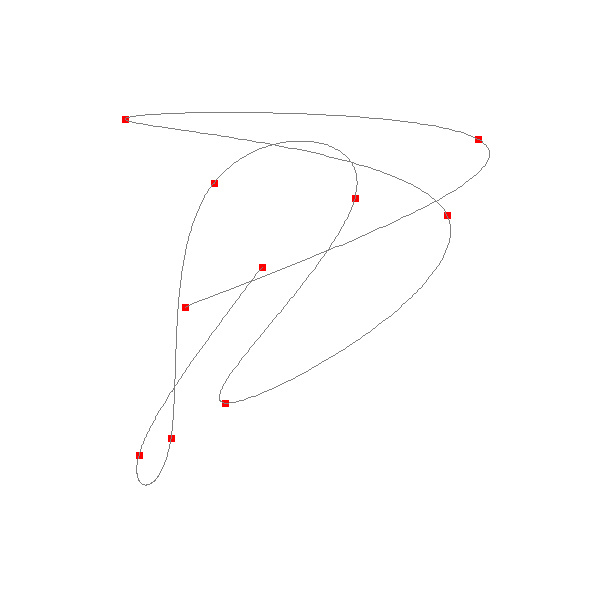
Combining curve markers
Initially, we thought to make a simple polyline, which will combine in a chronological order certain markers or groups of markers on the map. It is clear that this is most conveniently done using the google.maps.Polyline and google.maps.PolylineOptions classes. But first, our GUI designers, and then the programmers decided that it would be much more beautiful to have not a broken line, but a smooth (as far as point-based construction allows) curve, which will combine the markers of our users.
As in the case of grouping, we decided to design this curve on the server side in order not to overload the user's computer. After some short tests, we stopped at the interpolation method with cubic splines, the result of which is transferred from the server to JavaScript, which already draws it point by point using google.maps.Polyline.
Let us dwell on the algorithm. From the point of view of mathematics, he is nothing complicated. In PHP, we made the following classes:
- Point - just a visual storage of point coordinates
- Cubic - class to get the value of the function (of the form f (x) = d * x ^ 3 + c * x ^ 2 + b * x + a) and its derivative for a certain x and coefficients a, b, c, d
- Poly - interpolation itself
The following are minimized for understanding the source code of each of these classes.
Point.inc
<?php class Point { public $x; public $y; function __construct($x, $y){ $this->x = $x; $this->y = $y; } } ?> Cubic.inc
<?php class Cubic { private $a; private $b; private $c; private $d; function __construct($a, $b, $c, $d){ $this->a = $a; $this->b = $b; $this->c = $c; $this->d = $d; } public function eval_($u){ return (($this->d * $u + $this->c) * $u + $this->b) * $u + $this->a; } public function eval_derivative($u){ return $this->b + $u * (2 * $this->c + 3 * $this->d * $u); } } ?> Poly.inc
<?php class Poly { public $points; function __construct(){ $this->points = array(); } public function push($x, $y){ array_push($this->points, new Point($x, $y)); } public function getInterpolatedPoly($stepsNum = 12, $type = 'poly'){ $i = 0; $j = 0; $u = 0; $ret = new Poly(); $sizeofPoints = sizeof($this->points); if($sizeofPoints >= 2){ $xpts = $this->xpoints(); $ypts = $this->ypoints(); $xc = $this->calcNaturalCubic($sizeofPoints - 1, $xpts); $yc = $this->calcNaturalCubic($sizeofPoints - 1, $ypts); $ret->push($xc[0]->eval_(0), $yc[0]->eval_(0)); $stepsNum = 100; for($i = 0; $i < sizeof($xc); $i++){ for($j = 1; $j <= $stepsNum; $j++){ $u = $j / $stepsNum; $nx = $xc[$i]->eval_($u); $ny = $yc[$i]->eval_($u); $ret->push($nx, $ny); } } } if($type == 'array'){ $ret_ = array(); for($i = 0; $i < sizeof($ret->points); $i++){ array_push($ret_, array( 'x' => $ret->points[$i]->x, 'y' => $ret->points[$i]->y )); } return $ret_; } return $ret; } private function xpoints(){ return $this->getPointsArray('x'); } private function ypoints(){ return $this->getPointsArray('y'); } private function getPointsArray($type){ $r = array(); $sizeofPoints = sizeof($this->points); switch($type){ case 'y': for($i = 0; $i < $sizeofPoints; $i++) array_push($r, $this->points[$i]->y); break; case 'x': default: for($i = 0; $i < $sizeofPoints; $i++) array_push($r, $this->points[$i]->x); } return $r; } private function calcNaturalCubic($n, &$x){ $gamma = array(); $delta = array(); $D = array(); $i = 0; $gamma[0] = 1.0 / 2.0; for($i = 1; $i < $n; $i++) $gamma[$i] = 1 / (4 - $gamma[$i-1]); $gamma[$n] = 1 / (2 - $gamma[$n-1]); $delta[0] = 3 * ($x[1] - $x[0]) * $gamma[0]; for($i = 1; $i < $n; $i++) $delta[$i] = (3 * ($x[$i + 1] - $x[$i - 1]) - $delta[$i - 1]) * $gamma[$i]; $delta[$n] = (3 * ($x[$n] - $x[$n - 1]) - $delta[$n - 1]) * $gamma[$n]; $D[$n] = $delta[$n]; for($i = $n - 1; $i >= 0; $i--) $D[$i] = $delta[$i] - $gamma[$i] * $D[$i + 1]; $C = array(); for($i = 0; $i < $n; $i++) $C[$i] = new Cubic($x[$i], $D[$i], 3 * ($x[$i + 1] - $x[$i]) - 2 * $D[$i] - $D[$i + 1], 2 * ($x[$i] - $x[$i + 1]) + $D[$i] + $D[$i + 1]); return $C; } } ?> And here is the process of building our curves for arbitrary points. At the input we have a named $ points array with pairs of x and y values of each point.
<?php // require_once('Point.inc'); require_once('Cubic.inc'); require_once('Poly.inc'); // $points = array(); for($i = 0; $i < 10; $i++) $points[$i] = array('x' => rand(100, 500), 'y' => rand(100, 500)); // € $_poly = new Poly(); // foreach($points as &$point) $_poly->push($point['x'], $point['y']); // € € $lines = $_poly->getInterpolatedPoly(40, 'array'); // $img = imagecreatetruecolor(600, 600); // € , $whiteC = imagecolorallocate($img, 255, 255, 255); $greyC = imagecolorallocate($img, 127, 127, 127); $redC = imagecolorallocate($img, 255, 0, 0); // imagefill($img, 0, 0, $whiteC); // $halfOfPointWidth = 3; for($i = 0; $i < sizeof($points); $i++) imagefilledrectangle($img, $points[$i]['x'] - $halfOfPointWidth, $points[$i]['y'] - $halfOfPointWidth, $points[$i]['x'] + $halfOfPointWidth, $points[$i]['y'] + $halfOfPointWidth, $redC); // for($i = 0; $i < sizeof($lines) - 1; $i++) imageline($img, $lines[$i]['x'], $lines[$i]['y'], $lines[$i+1]['x'], $lines[$i+1]['y'], $greyC); // png € header('Content-Type:image/png'); imagepng($img); // € imagedestroy($img); ?> At the output we have an array with coordinates for plotting a curve by points. Here is a visualized example of what happened:
And by changing a few settings, you can create an improvisation on the theme “HabraHabr Logo”:
In the near future, we plan to slightly refine our curves so that they are not just a line, but small arrows that show direction.
But now we believe that we gave artists, producers and organizers a convenient and beautiful way to tell everyone around what they do, what events they take part in as organizers or performers and where they are going to be at one time or another.
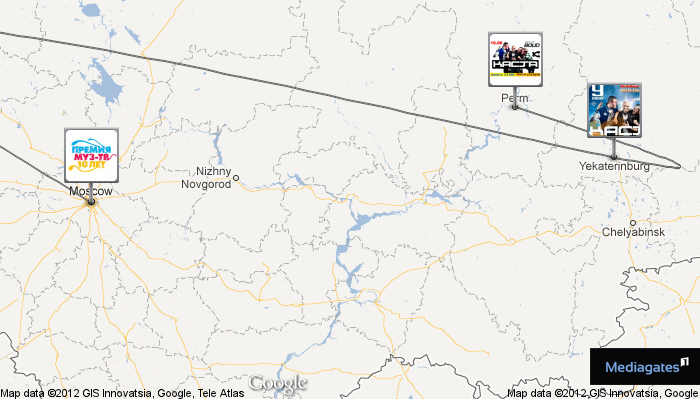
Static maps and export to JPG
After the user plans his tour on the map and calendar, he will certainly want to notify his friends on social networks or publish this information on his blog. To do this, we made it possible to save the current map view with all the markers on the user's computer in JPG format.
We implemented it like this: when you click on the “Save as JPG” button, Java Script sends all the information about the current map view and markers on it to the server, which loads the required map piece using the Google Static Maps API, saves markers on it and temporary storage file, a link to which is returned to the user in the browser.
It would seem that nothing complicated: the main thing that should not be done is to try to place markers on the map on your own after uploading the image from the Google Static Maps API - nothing good will come of it. The solution is much simpler: the API allows you to place external images when you specify their coordinates on the map.
Here, one question remained open for us: how would you like to post a card on the user's wall on fb.com or vk.com? We cannot say that we studied the problem in detail, but nothing better than exporting the map to jpg image, and then manually publishing it on the wall, we did not invent. I would be happy if you tell me any way to publish a large image in the background. At the same time, we must understand that this image does not fit the concept of user-generated, which allows you to post a large size on Facebook.
Search on the map
In conclusion, we would like to add a few words about the search for objects on the map. When we thought about this function, we tried to combine the convenience of a graphical interface and getting the most relevant results. From the point of view of the UI, I always liked the search on afisha.ru very much - you enter everything you like, and he himself tells you what is on the site by this request and sorts by content types.
As a result, we used the search engine (or server, as it is sometimes called) sphinx, on which the main search on our site is based. With it, we get the most relevant data on user request from the database. Also, in case the user wants to find an address, we make a request to the Google Geocoding API.
Search results by database and addresses are displayed sorted by type after the first three characters entered by the user and make it possible by clicking on them to quickly move to the place on the map where this object is located.
Conclusion
In general, perhaps, and everything that we would like to tell on this issue. We are, of course, very interested in how habrayuzer will relate to the project, to the cards, in particular, and whether we survive the habraeffect. So welcome, register, check, test. Those who help with tips on exporting a card to Facebook and VKontakte will be very grateful.
Source: https://habr.com/ru/post/145411/
All Articles