Forecasting purchases: hellish, but very useful math
Imagine two heroes: merchant Alexander and sysadmin Vasily. Vasya, as the personification of the average client, comes into the store of Sasha (a retail network representative) every evening and buys beer. Sasha orders for him 7 bottles of beer per week. Sometimes Vasya remains to work overnight and does not leave the server room, and sometimes - after work he takes two bottles of beer for himself and the chief accountant.
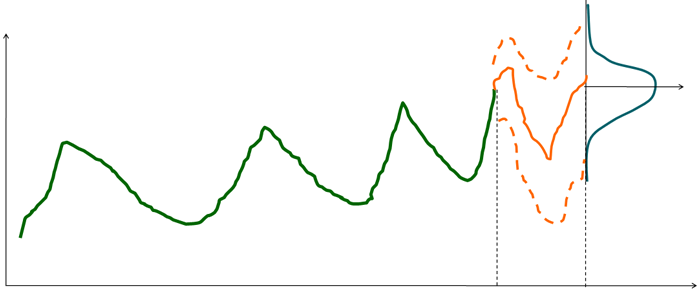
Graph of demand for beer depending on the life adventures of Vasya
Sasha cannot predict these periods, so he is constantly between two fires: either buy more goods, freeze money and invest in its storage, or buy exactly the average demand, risking to upset Vasya and his accountant friend at some point by lacking the necessary quantities of beer.
')
So, a lot of goods in stock for Sasha is bad. Money has been invested and “frozen” in it, and it is also expensive to keep it. Few goods in the store are bad, customers do not find what they need, it loses them and direct profits. To know how much goods to buy, you need a system for predicting demand . The same system helps to maintain the right amount of goods on the points.
Demand and supply are described by the objective function, which consists of two parts: on the one hand, it is under-forecast, and on the other - re-forecast. On the one hand, the costs, if the goods lie too long, on the other - lost profits. Plus, it is worth remembering that there are still such things as expired products, aging software on disks and other problems such as keeping the display in the right form.
In the simplest case, two values in money are obtained: what will happen if it is under-purchased or imported extra goods. The system analyzes all products of the trading network separately and makes forecasts.
Trading networks seek to optimize the process of supply . One of the important points is that it is necessary to consider not in pieces, but in total costs, for example, for the work of personnel and the efficiency of processes. For the network, the profit is the result, not the accuracy of the forecast itself. So, everything depends on the rest of the goods in the warehouse, where the buyers order it. In order to properly manage the stock, we must first predict the demand. At the same time, demand is not sales: in the absence of goods, demand may be, but there will be no sales. This is a very important difference, because many systems operate with sales.
The first step of analytics in our case is to restore real demand, tracking all the moments when the product was actually unavailable (for example, the beer case was listed in the database, but in fact was lost in stock).
The point is in replacing the “breaks” of a product with some calculated value. You can use several different averaging methods, for example, a moving average: calculations are not as important as the principle itself. So, first of all, we restore the level of demand. Then we build a forecast for the next period. Next, we need to get corrections for the fact that real demand is always different from the forecast, that is, to build an optimal corridor of tolerances.
For example, an average of 7 bottles are bought from us per day, but they can buy at a peak of 10, and a minimum of 4. So, the corridor is 7, plus or minus 3. This, again, is on average. Sometimes it happens that our Vasya is having a party and wants 20 bottles at once, but in such cases, according to calculations, it is more profitable for us to sell 10 and send him to look for fuel further than to keep 10 extra in the warehouse. In the end, he is a sysadmin, and parties are extremely rare for him. A confidence interval is constructed when the probability of forecasting demand from 4 to 10 units is 80%. If the scatter for a product is large (for example, when we sell 4-10 blade servers), this is an excuse to deal with the product manually. When the spread is small (4-10 clips) - it is quite possible to entrust the automation.
Next you need to understand what should be the balance at the time of delivery, so that it will be enough until the next delivery. There is already money, a balance of losses. We add a target function that describes the losses from non-prediction and prediction, and this objective function adds risks. Accordingly, as a rule, it turns out that it is more profitable to re-order the goods, since it will still sell, and the fact that we purchased it is not so bad, and the cost of abstract money is not that big either.
The cost of abstract money can be considered differently. The easiest option - at the bank rate - what will happen if we put the money on deposit. A better way is to estimate the real value of abstract money by the average business performance. This bid is important for predicting the reorder upper bound.
Further, when we added an error from a non-forecast and a forecast in money, we can estimate at what size of a rest this error will be minimum. The next step: you need to put this product. For example, the analyst proposes to have 14 bottles of beer. Obviously, we can only carry them in boxes, that is, it is either 12 or 24. It is necessary to understand that it is more profitable: not to bring this box and upset the sysadmin Vasily, who buys beer from us every evening, or have a box and sit with extra bottles . Marketers can give an approximate heuristics on the importance of retaining customers by maintaining the range - and this can also be taken into account in the function.
In my practice of implementation in retail networks, up to 3% of the company's turnover is saved.
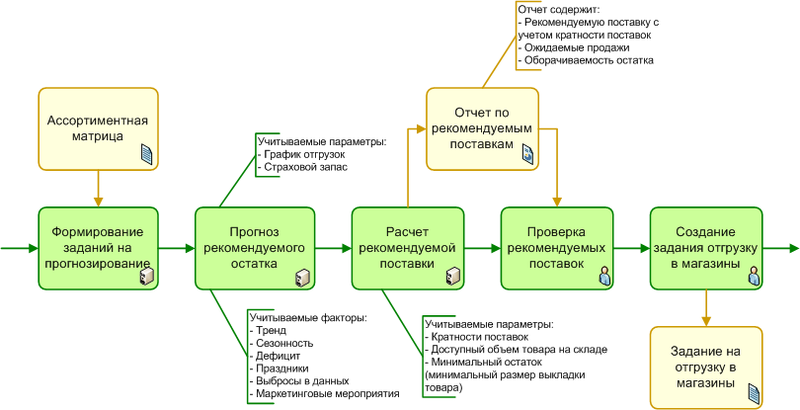
Usually analysts work, they usually run on historical data. From the point of view of the results of the system, everything is simple: three numbers are issued: this is the demand forecast, the recommended balance and the recommended order. Further, all this is loaded into the order interface, which is already familiar to merchandise specialists. They see no change in terms of their work, they just have other numbers. There is no need to change other systems.

Implementation example
Automation can predict trends, for example, take into account advertising campaigns, but always needs adjustments in markets with high volatility of demand. For example, in the fashion industry, intuition and experience are more important than such automation, in the cellular retail at top positions it is also problematic to consider only an automatic. The difference is: trading, for example, hard disks or bread, we meet the demand. Trading in fashionable dresses or tablets of the new generation - we create it.
Graph of demand for beer depending on the life adventures of Vasya
Sasha cannot predict these periods, so he is constantly between two fires: either buy more goods, freeze money and invest in its storage, or buy exactly the average demand, risking to upset Vasya and his accountant friend at some point by lacking the necessary quantities of beer.
')
So, a lot of goods in stock for Sasha is bad. Money has been invested and “frozen” in it, and it is also expensive to keep it. Few goods in the store are bad, customers do not find what they need, it loses them and direct profits. To know how much goods to buy, you need a system for predicting demand . The same system helps to maintain the right amount of goods on the points.
What does it look like in principle?
Demand and supply are described by the objective function, which consists of two parts: on the one hand, it is under-forecast, and on the other - re-forecast. On the one hand, the costs, if the goods lie too long, on the other - lost profits. Plus, it is worth remembering that there are still such things as expired products, aging software on disks and other problems such as keeping the display in the right form.
In the simplest case, two values in money are obtained: what will happen if it is under-purchased or imported extra goods. The system analyzes all products of the trading network separately and makes forecasts.
What is important for Sasha: correct order or big profit?
Trading networks seek to optimize the process of supply . One of the important points is that it is necessary to consider not in pieces, but in total costs, for example, for the work of personnel and the efficiency of processes. For the network, the profit is the result, not the accuracy of the forecast itself. So, everything depends on the rest of the goods in the warehouse, where the buyers order it. In order to properly manage the stock, we must first predict the demand. At the same time, demand is not sales: in the absence of goods, demand may be, but there will be no sales. This is a very important difference, because many systems operate with sales.
We restore demand
The first step of analytics in our case is to restore real demand, tracking all the moments when the product was actually unavailable (for example, the beer case was listed in the database, but in fact was lost in stock).
The point is in replacing the “breaks” of a product with some calculated value. You can use several different averaging methods, for example, a moving average: calculations are not as important as the principle itself. So, first of all, we restore the level of demand. Then we build a forecast for the next period. Next, we need to get corrections for the fact that real demand is always different from the forecast, that is, to build an optimal corridor of tolerances.
Looking at Vasya
For example, an average of 7 bottles are bought from us per day, but they can buy at a peak of 10, and a minimum of 4. So, the corridor is 7, plus or minus 3. This, again, is on average. Sometimes it happens that our Vasya is having a party and wants 20 bottles at once, but in such cases, according to calculations, it is more profitable for us to sell 10 and send him to look for fuel further than to keep 10 extra in the warehouse. In the end, he is a sysadmin, and parties are extremely rare for him. A confidence interval is constructed when the probability of forecasting demand from 4 to 10 units is 80%. If the scatter for a product is large (for example, when we sell 4-10 blade servers), this is an excuse to deal with the product manually. When the spread is small (4-10 clips) - it is quite possible to entrust the automation.
We consider Sasha's money
Next you need to understand what should be the balance at the time of delivery, so that it will be enough until the next delivery. There is already money, a balance of losses. We add a target function that describes the losses from non-prediction and prediction, and this objective function adds risks. Accordingly, as a rule, it turns out that it is more profitable to re-order the goods, since it will still sell, and the fact that we purchased it is not so bad, and the cost of abstract money is not that big either.
The cost of abstract money can be considered differently. The easiest option - at the bank rate - what will happen if we put the money on deposit. A better way is to estimate the real value of abstract money by the average business performance. This bid is important for predicting the reorder upper bound.
Further, when we added an error from a non-forecast and a forecast in money, we can estimate at what size of a rest this error will be minimum. The next step: you need to put this product. For example, the analyst proposes to have 14 bottles of beer. Obviously, we can only carry them in boxes, that is, it is either 12 or 24. It is necessary to understand that it is more profitable: not to bring this box and upset the sysadmin Vasily, who buys beer from us every evening, or have a box and sit with extra bottles . Marketers can give an approximate heuristics on the importance of retaining customers by maintaining the range - and this can also be taken into account in the function.
What is the efficiency?
In my practice of implementation in retail networks, up to 3% of the company's turnover is saved.
Who in companies works with this thing?
Usually analysts work, they usually run on historical data. From the point of view of the results of the system, everything is simple: three numbers are issued: this is the demand forecast, the recommended balance and the recommended order. Further, all this is loaded into the order interface, which is already familiar to merchandise specialists. They see no change in terms of their work, they just have other numbers. There is no need to change other systems.
Implementation example
What are the limitations of the system?
Automation can predict trends, for example, take into account advertising campaigns, but always needs adjustments in markets with high volatility of demand. For example, in the fashion industry, intuition and experience are more important than such automation, in the cellular retail at top positions it is also problematic to consider only an automatic. The difference is: trading, for example, hard disks or bread, we meet the demand. Trading in fashionable dresses or tablets of the new generation - we create it.
Source: https://habr.com/ru/post/145385/
All Articles