Habrahabr statistics
Almost a week has passed since the execution of Habrahabr 6 years. It would be very interesting to look at the graphs of growth indicators of the site. Because Standard statistics are uninformative, it was decided to collect all the information with their own hands and analyze. And so, almost a week of parsing and collecting information and obtained the following interesting data (hidden / deleted posts / users and their comments are not taken into account):
Beautiful graphs, measurement methods, a base with the obtained data, “habanoanomalies” - all this is under the cut.

y is the number of published topics per month; x - timeline, 1 division - month
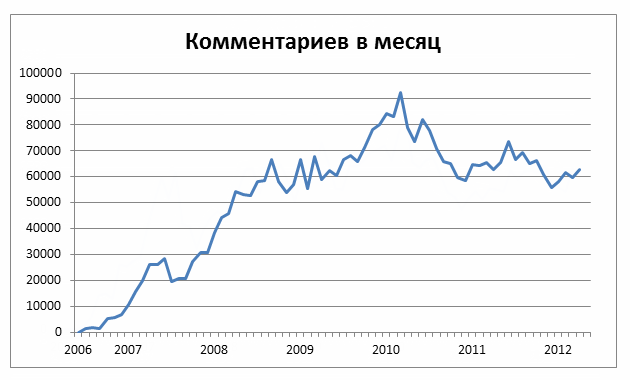
y is the number of published comments per month; x - timeline, 1 division - month
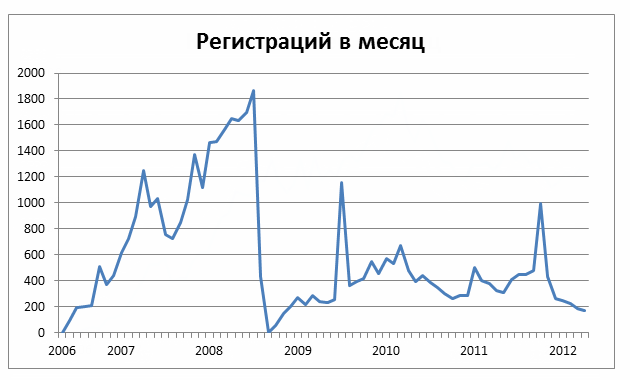
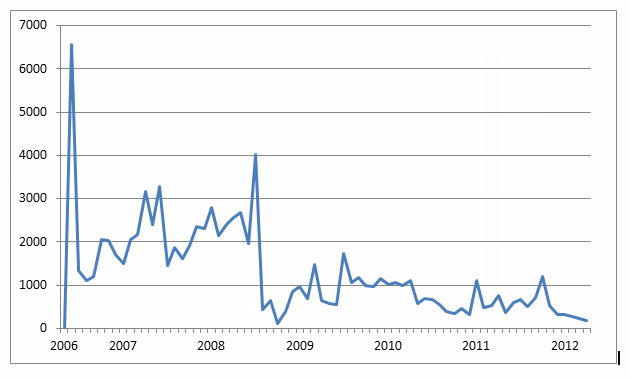
y is the number of user registrations per month; x - timeline, 1 division - month
The answer to the question of what caused such a failure in the number of registrations that began in August 2008 and reached a minimum in September (1 registration per month), I did not find. Perhaps users registered during this period were massively banned / transferred to read-only.

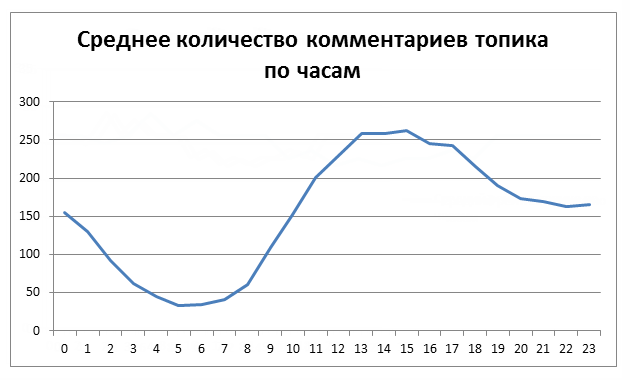
y is the average number of topics currently published; x - timeline, 1 division - hour
This schedule was obtained by counting the number of published topics in a given hour over 6 years. If you take a smaller frame, it is possible to shift the schedule.
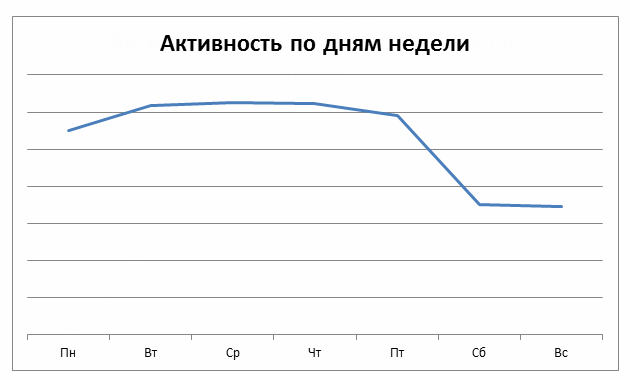
y is the average number of topics currently published; x - timeline, 1 division - day
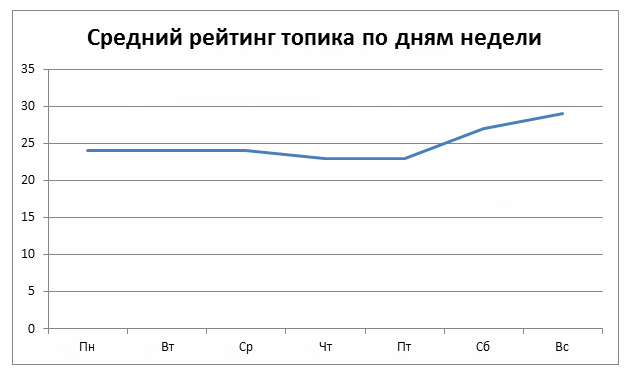
y is the average final grade of topics for all time; x - timeline, 1 division - day
As it turned out, more benefits are gaining topics published on the weekend. Perhaps this is due to the fact that on the weekend they are published in half.
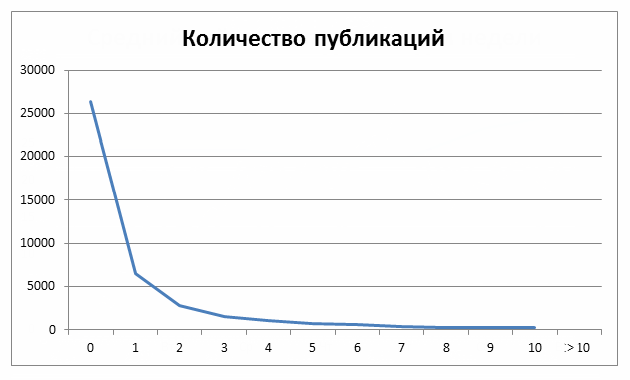
y is the number of users with the number of topics indicated in the x scale; x - the number of user topics
No matter how sad, but a little more than half of the users have not published a single topic.
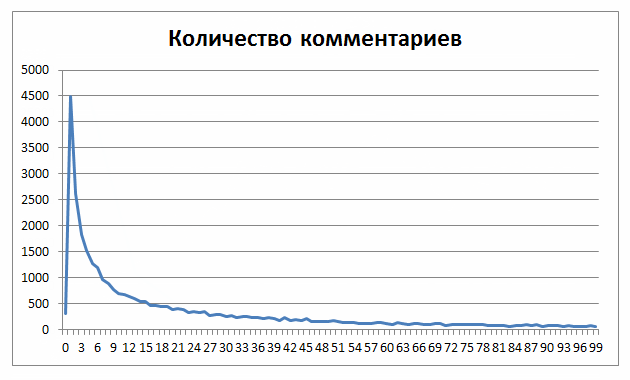
y is the number of users with the number of comments specified in the x scale; x - number of user comments
As can be seen from the graph, about 15% of users post 1-5 comments and stop their activity.
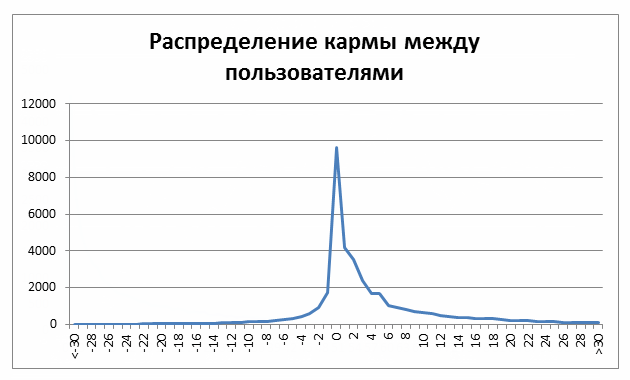
y is the number of users with the number of karma specified in the x scale; x - number of user's karma
20% of users have zero karma. Pleases the odds number of users in the positive part.
')
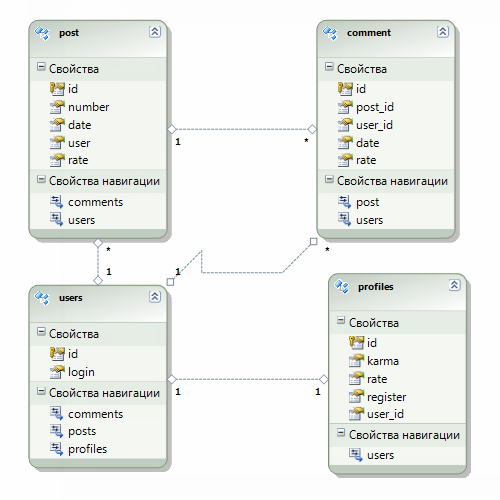
Because there is no direct access to the Habra database, then I had to look for workarounds. If you have noticed, then each topic has its number in the address bar, i.e. we can view the very first post on habrahabr.ru/post/1 . The decision came quickly, it is necessary to sort out all the published topics, starting with 1 and ending with the 144,400 number (at that time the last topic, which has already expired voting). Of these, 121,641 topics exist, of which 25,949 are moved to drafts and a few hundred more are empty, like this: habrahabr.ru/company/muk/blog/119653 . All topics were saved to files for further parsing, took almost 10GB. Then each topic was parsed as follows: the author of the topic was taken, the rating, the date of publication, after that the comments were parsed, of which the author was taken, the rating of the comment and the date. We got three tables. After receiving all the users, it was necessary to get for each his karma value and rating. With this approach, all those who post at least once or post a comment were considered. All this was pumped out and parsed for about a week around the clock. The parsing software was written in the data entry process. The frequency of requests to Habr did not exceed 1 request per second.
DB structure:
Download the database dump (MSSQL backup) here (132Mb):
During the parsing, a whole bunch of anomalies were found:
PS I accept suggestions for building interesting graphs based on the information received.
Added by:
y is the number of user posts registered in the specified x scale; x - timeline, 1 division - month
From this diagram it follows that the users who registered before mid-2008 wrote the most topics.

The most mined topics:
The most mined comments:
Most mined users (by karma):
Ten first comments:
I will note that the average rating of the first comment is +3.59, while the average rating of all comments is +0.98
The most exciting comment
- Most posts were written by alizar - 4298, a record of 12 posts per day was set on October 18, 2006
- Most of the comments were written by VolCh - 19323, setting a personal record on July 27, 2011 in the amount of 140 comments.
- Most posted posts on the day freetonik —21 topic August 26, 2007
- The maximum activity of habr per day - 105 topics were published: February 18, 2010 and June 22, 2008.
- The maximum activity of habr per month - published 2055 topics in March 2010
- The average value of karma: +7.83
- Average rating of topic: +24,75
- Total comments: 3,703,022.
- Average comment rating: +0.98
- The maximum number of comments left - July 1, 2011 in the amount of 4936 pieces.
- 25% of all published topics were transferred to drafts
- The most commented topic habrahabr.ru/post/123157 collected 2252 comments
Beautiful graphs, measurement methods, a base with the obtained data, “habanoanomalies” - all this is under the cut.
y is the number of published topics per month; x - timeline, 1 division - month
y is the number of published comments per month; x - timeline, 1 division - month
y is the number of user registrations per month; x - timeline, 1 division - month
The answer to the question of what caused such a failure in the number of registrations that began in August 2008 and reached a minimum in September (1 registration per month), I did not find. Perhaps users registered during this period were massively banned / transferred to read-only.
y is the average number of topics currently published; x - timeline, 1 division - hour
This schedule was obtained by counting the number of published topics in a given hour over 6 years. If you take a smaller frame, it is possible to shift the schedule.
y is the average number of topics currently published; x - timeline, 1 division - day
y is the average final grade of topics for all time; x - timeline, 1 division - day
As it turned out, more benefits are gaining topics published on the weekend. Perhaps this is due to the fact that on the weekend they are published in half.
y is the number of users with the number of topics indicated in the x scale; x - the number of user topics
No matter how sad, but a little more than half of the users have not published a single topic.
y is the number of users with the number of comments specified in the x scale; x - number of user comments
As can be seen from the graph, about 15% of users post 1-5 comments and stop their activity.
y is the number of users with the number of karma specified in the x scale; x - number of user's karma
20% of users have zero karma. Pleases the odds number of users in the positive part.
')
As it was considered
Because there is no direct access to the Habra database, then I had to look for workarounds. If you have noticed, then each topic has its number in the address bar, i.e. we can view the very first post on habrahabr.ru/post/1 . The decision came quickly, it is necessary to sort out all the published topics, starting with 1 and ending with the 144,400 number (at that time the last topic, which has already expired voting). Of these, 121,641 topics exist, of which 25,949 are moved to drafts and a few hundred more are empty, like this: habrahabr.ru/company/muk/blog/119653 . All topics were saved to files for further parsing, took almost 10GB. Then each topic was parsed as follows: the author of the topic was taken, the rating, the date of publication, after that the comments were parsed, of which the author was taken, the rating of the comment and the date. We got three tables. After receiving all the users, it was necessary to get for each his karma value and rating. With this approach, all those who post at least once or post a comment were considered. All this was pumped out and parsed for about a week around the clock. The parsing software was written in the data entry process. The frequency of requests to Habr did not exceed 1 request per second.
DB structure:
Download the database dump (MSSQL backup) here (132Mb):
- torrent: tinyurl.com/bqy5g7c
- narod.ru: narod.ru/disk/51378386001.7a6c403f0422f2ca2edbaba1275c3ffd/backup.sql.html
Habroanomial
During the parsing, a whole bunch of anomalies were found:
- Topics published six months before the foundation of habr: habrahabr.ru/post/1453 habrahabr.ru/post/1455
- Registered users back in 1970: Nks PeterParker
- Users who seem to be habrahabr.ru/post/100012/#comment_3089391 , but at the same time there are no netrider (when trying to request a 404 user profile error)
PS I accept suggestions for building interesting graphs based on the information received.
Added by:
y is the number of user posts registered in the specified x scale; x - timeline, 1 division - month
From this diagram it follows that the users who registered before mid-2008 wrote the most topics.
It would be very interesting to see more such data:
* average rating of topics by the hour (by day there, but more interesting)
* average number of votes per topic according to the time of the creation of the topic
* the average number of comments on topics by the hour exactly in time to create a topic
Such information can give an idea of when it is best to publish in order to get maximum activity.
in general, it would be interesting to still see the total statistics on tags and hubs, but I understand that the parser will have to be run again.
There is a section "Best of all time." It would be interesting to look at the "worst of all time." habrahabr.ru/post/145045/#comment_4873731
The most mined topics:
- Bolgenos is not just another Linux build –268
- Lebedev lies! -198
- I want to burn the idea of a startup (1) -193
The most mined comments:
- habrahabr.ru/post/118370/#comment_3859046 -219
- habrahabr.ru/post/119754/#comment_3918136 -203 (Lost image in comments
- habrahabr.ru/post/63854/#comment_1774342 -192
- habrahabr.ru/post/119754/#comment_3918076 -177
Most mined users (by karma):
Ten first comments:
- 466 - bondbig
- 448 - jeje
- 396 - Vox
- 294 - nooze
- 293 - NaFigator
- 255 - amarao
- 237 - XaocCPS
- 204 - dohlik
- 202 - LeeMiller
- 200 - Mithgol
I will note that the average rating of the first comment is +3.59, while the average rating of all comments is +0.98
The most exciting comment
Source: https://habr.com/ru/post/145045/
All Articles