What is the cause of the blockage? Web application statistics
In the past, our post attentive dovg habrauzer noted a screenshot with a beautiful schedule. It reflected the time of the various search operations. And since statistics and performance analysis of high-load projects is a rather topical issue, we decided to tell you about the system that we use to collect and analyze Mamba statistics. As in the case of search, we use our own solution, but unlike BTP (no one remembers how this abbreviation came into being, but for some reason it became the name) is in the public domain, and if you want, you can install it on their servers.
The system provides the following types of statistics:
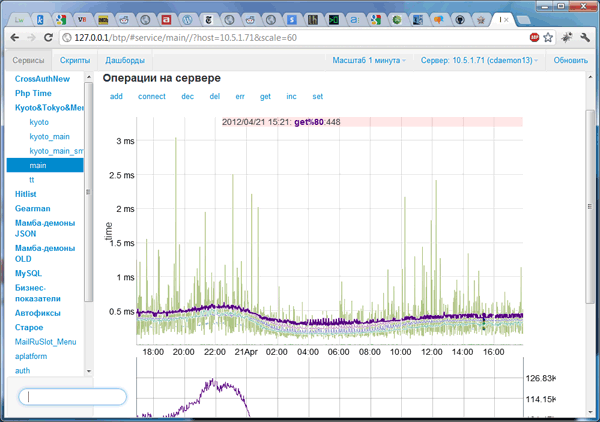
To get the most complete picture of how applications work, we used the information view in two hierarchies. The first is quite traditional: service-server-operation. It allows you to determine the load on services, the uniform distribution of load across servers and the frequency of use of specific operations.
Here is reflected, for example, the number of queries to clustered databases. Monitoring the response time of each of them allows us to understand the overall performance, and in case of problems, find out which specific base slows down the most. In the same hierarchy, we look at the fact that only selects have increased, or also updates; normal or increased cache load, etc. In other words, in case of problems, here we determine the point of failure - which service / server reduces overall performance. At the same time, processing the information, the web interface also takes data from the second hierarchy, displaying which scripts most use the operation of interest to us of a particular service.
')
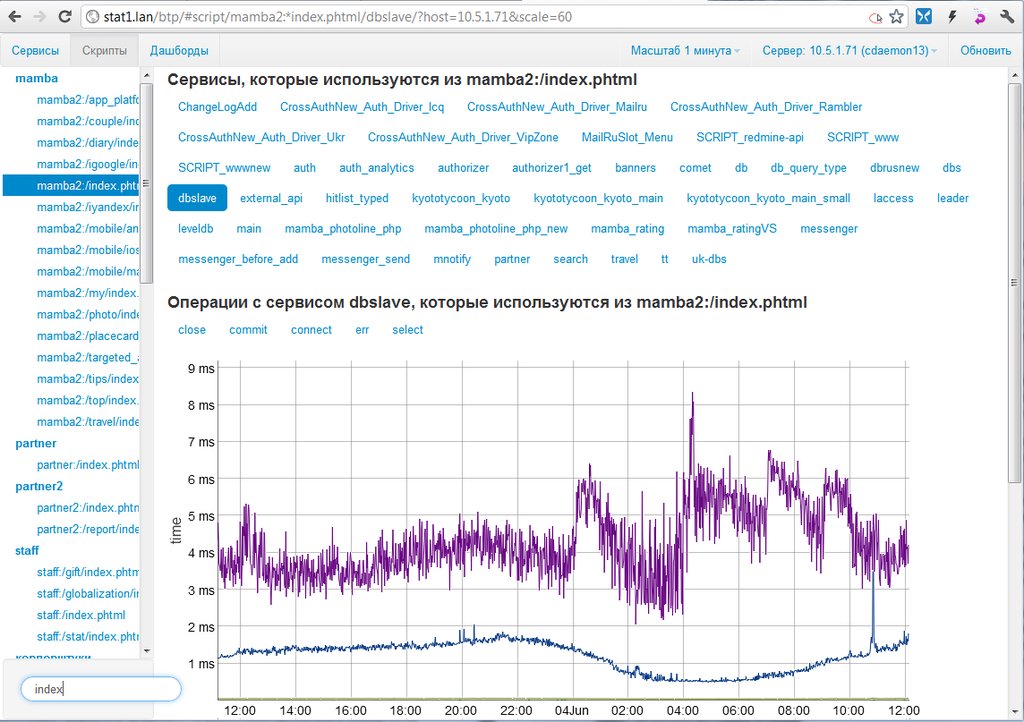
The second hierarchy, the script-service-operation, can be used to find out the specific “cause of blockage,” namely, what the inhibitory script refers to and what it spends time on. In this hierarchy, you can determine which specific services the script uses, how many requests it makes and how long it takes to respond to these requests. This is how it is possible, for example, to determine why a change in the script code led to an increase in the load on a specific database.
The most common measure of web application performance is response time. Many systems limit analytics to average and borderline response times, but in practice these data may turn out to be a “spherical horse in a vacuum.” Suppose that 10% of visitors get the right page 10-20 times slower than the rest 90%. This does not affect the average, but with a million audience it will result in hundreds of thousands of disgruntled users. Therefore, we use reports on percentiles and we can see not only the average indicators, but also the values that contain 50, 80, 95 and 99 percent of operations. This allows us to get a much more relevant result in terms of “user satisfaction”.

In developing the system, we immediately assumed that the number and composition of the measured parameters may vary. In addition, long-term analytics is impossible without analyzing the data stored for a certain period of time, so we also paid special attention to storing the available statistics.
As a result, from a technical point of view, the system consists of the following parts:
When you enter the web interface, you immediately see the statistics on the counters from your script. Statistics for the last ~ 2 hours is calculated with a resolution of 5 seconds. Day - with a resolution of 1 minute (well, there is, of course, statistics for the month and year with a resolution of 30 minutes and 6 hours, respectively).
For drawing graphs, the web interface uses client templates, Backbone.js and dygraphs, and almost all is written in javascript, with the exception of the small http-to-json-rpc-proxy js.php file, and index.php (which collects client templates on the page from a separate directory).
Actually on the charts should stay separately. For their generation and output we tried to use several different libraries, including highcharts, raphael.js and envision.js, but we stopped at dygraphs. We talked about as follows:
Raphael: svg-based library, in which almost everything has to be done by hand. Including draw a grid in the form of segments SVG. And while it does not have a high speed.
Highcharts: much simpler than Raphael, also svg-based, but with customization, there are some difficulties. And also not very fast (3-4 graphics with 1.5 thousand points significantly slow down).
Envision.js: canvas-based, a bit faster (if you don’t use all sorts of interesting things like mini-navigation). In general, a good option.
Dygraphs: the smartest. The existing functionality is implemented relatively simply, but some possibilities are not enough (for example, it was not possible to draw two graphs on one screen in different representations: in the form of a filled area and a simple line). However, the speed of work has exceeded that of other libraries by several times. As a result, the choice was stopped on Dygraphs.
Naturally, there are other systems for collecting statistics, for example, New Relic and Pinba. But BTP has several advantageous differences.
It differs from New Relic in that, firstly, it is an open product, and secondly, it is focused on monitoring application parameters (what is called custom metrics in new relic). And thirdly, the installation of php extension and the java proxy agent is not necessary. Although we must admit that the interface for New Relic is more “licked”.
Our system differs from Pinba, firstly, by simpler installation (no plugin for MySQL is needed, extension is not needed), and secondly, by the fact that pinba is only involved in calculating statistics. Pinba does not store and does not display data, and in order to do this, you have to attach cron-scripts to Pinba, rrdtool with a bunch of command line parameters and tools for drawing graphs. And of course, when adding new counters, you need to remember to save the data from them too.
References:
BTP / Demon
https://github.com/mambaru/btp-daemon
Pictures
BTP / Web Interface
https://github.com/mambaru/btp-webui
BTP / Our client
https://github.com/mambaru/btp-api
BTP / Python client
https://github.com/mastergenius/pybtp
New relic
https://newrelic.com/docs/php/the-php-api
Pinba
http://pinba.org/wiki/Main_Page
The system provides the following types of statistics:
- on operations on the service (for example, "mysql" or "memcache")
- on operations on a specific service server (for example, the mysql service and the db7 server)
- on scripts that use some kind of service operation (for example, “update” of the “mysql” service)
- on services / operations that a particular script uses
To get the most complete picture of how applications work, we used the information view in two hierarchies. The first is quite traditional: service-server-operation. It allows you to determine the load on services, the uniform distribution of load across servers and the frequency of use of specific operations.
Here is reflected, for example, the number of queries to clustered databases. Monitoring the response time of each of them allows us to understand the overall performance, and in case of problems, find out which specific base slows down the most. In the same hierarchy, we look at the fact that only selects have increased, or also updates; normal or increased cache load, etc. In other words, in case of problems, here we determine the point of failure - which service / server reduces overall performance. At the same time, processing the information, the web interface also takes data from the second hierarchy, displaying which scripts most use the operation of interest to us of a particular service.
')
The second hierarchy, the script-service-operation, can be used to find out the specific “cause of blockage,” namely, what the inhibitory script refers to and what it spends time on. In this hierarchy, you can determine which specific services the script uses, how many requests it makes and how long it takes to respond to these requests. This is how it is possible, for example, to determine why a change in the script code led to an increase in the load on a specific database.
The most common measure of web application performance is response time. Many systems limit analytics to average and borderline response times, but in practice these data may turn out to be a “spherical horse in a vacuum.” Suppose that 10% of visitors get the right page 10-20 times slower than the rest 90%. This does not affect the average, but with a million audience it will result in hundreds of thousands of disgruntled users. Therefore, we use reports on percentiles and we can see not only the average indicators, but also the values that contain 50, 80, 95 and 99 percent of operations. This allows us to get a much more relevant result in terms of “user satisfaction”.
In developing the system, we immediately assumed that the number and composition of the measured parameters may vary. In addition, long-term analytics is impossible without analyzing the data stored for a certain period of time, so we also paid special attention to storing the available statistics.
As a result, from a technical point of view, the system consists of the following parts:
- Demon
Accepts and processes data counters; considers, stores and issues statistics. It works using the JSON-RPC protocol, and uses the kyoto cabinet library for storage (the key-value embedded repository). - Web interface
The actual interface for viewing statistics. Draws graphs (more on the graphs below). - Customer
This is the part that integrates into your application. Sends counters to the daemon. In this case, you can use a ready-made client in PHP or Python, and also, if you wish, write your own.
When you enter the web interface, you immediately see the statistics on the counters from your script. Statistics for the last ~ 2 hours is calculated with a resolution of 5 seconds. Day - with a resolution of 1 minute (well, there is, of course, statistics for the month and year with a resolution of 30 minutes and 6 hours, respectively).
For drawing graphs, the web interface uses client templates, Backbone.js and dygraphs, and almost all is written in javascript, with the exception of the small http-to-json-rpc-proxy js.php file, and index.php (which collects client templates on the page from a separate directory).
Actually on the charts should stay separately. For their generation and output we tried to use several different libraries, including highcharts, raphael.js and envision.js, but we stopped at dygraphs. We talked about as follows:
Raphael: svg-based library, in which almost everything has to be done by hand. Including draw a grid in the form of segments SVG. And while it does not have a high speed.
Highcharts: much simpler than Raphael, also svg-based, but with customization, there are some difficulties. And also not very fast (3-4 graphics with 1.5 thousand points significantly slow down).
Envision.js: canvas-based, a bit faster (if you don’t use all sorts of interesting things like mini-navigation). In general, a good option.
Dygraphs: the smartest. The existing functionality is implemented relatively simply, but some possibilities are not enough (for example, it was not possible to draw two graphs on one screen in different representations: in the form of a filled area and a simple line). However, the speed of work has exceeded that of other libraries by several times. As a result, the choice was stopped on Dygraphs.
Naturally, there are other systems for collecting statistics, for example, New Relic and Pinba. But BTP has several advantageous differences.
It differs from New Relic in that, firstly, it is an open product, and secondly, it is focused on monitoring application parameters (what is called custom metrics in new relic). And thirdly, the installation of php extension and the java proxy agent is not necessary. Although we must admit that the interface for New Relic is more “licked”.
Our system differs from Pinba, firstly, by simpler installation (no plugin for MySQL is needed, extension is not needed), and secondly, by the fact that pinba is only involved in calculating statistics. Pinba does not store and does not display data, and in order to do this, you have to attach cron-scripts to Pinba, rrdtool with a bunch of command line parameters and tools for drawing graphs. And of course, when adding new counters, you need to remember to save the data from them too.
References:
BTP / Demon
https://github.com/mambaru/btp-daemon
Pictures
BTP / Web Interface
https://github.com/mambaru/btp-webui
BTP / Our client
https://github.com/mambaru/btp-api
BTP / Python client
https://github.com/mastergenius/pybtp
New relic
https://newrelic.com/docs/php/the-php-api
Pinba
http://pinba.org/wiki/Main_Page
Source: https://habr.com/ru/post/144910/
All Articles