Sending letters to Google Docs (Drive)
Creating statistics and managing mailings
to Google Docs (from different accounts) based on FormEmailer
We, Big Brother Ltd., decided to create statistics for mailing results using a script - FormEmailer template. Let's tell how it was done.
For the curious, I'll show you what we are striving for.
It will look something like this:
')
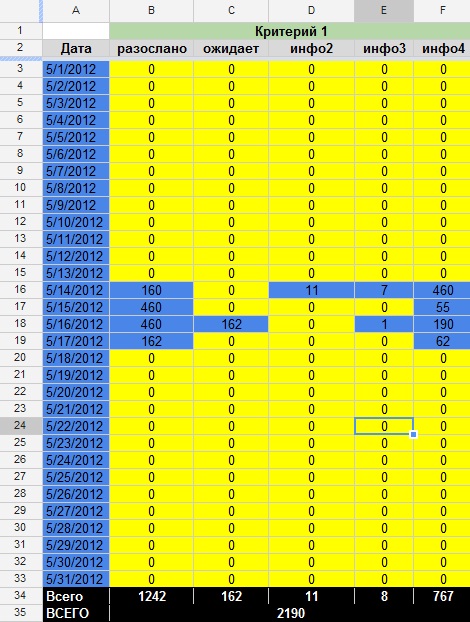
Figure 1: Final View.
Now we will start the most interesting - implementation.
To work with the mailing list, we will use a script - the FormEmailer template. It is multi-functional, flexible to configure, and with little effort becomes a really powerful tool.
Create a “Newsletter” table in Google Docs.
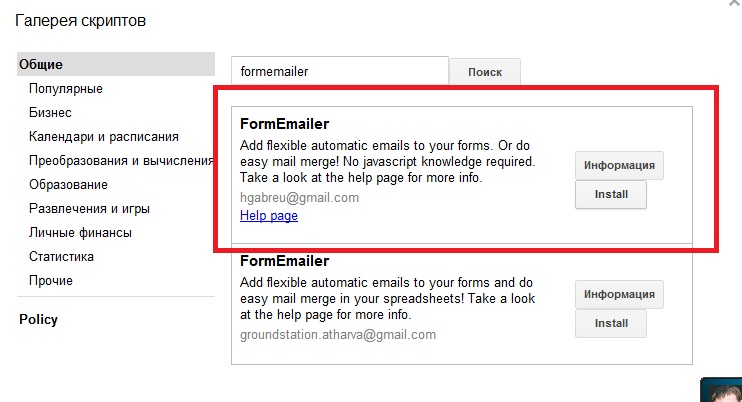
Click “Insert” -> “Script”, find FormEmailer from hgabreu, click Install. Log in, giving the right to use your calendar.
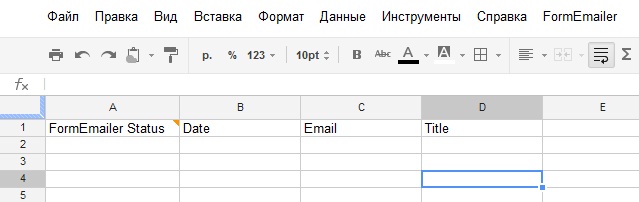
After installation, the Form Emailer item appears in the menu.

When you click on it, you will see the Install menu. Click on it and get a form with a choice of language and a sheet with data (here you will collect the base for distribution).
I will make a reservation, in the BASIS FOR BROADCAST we include only our subscribers.
It is also important to take into account the specifics of the limitations of Google tables. Therefore, we strongly recommend that you read this section. Read here.
IMPORTANT: In order for everything to be created without errors and problems, the sheet must contain at least the names of the columns (to have a header).
If the base for sending you have more than a couple of thousand, you need to use additional accounts and make the same manipulations in them.
If you have any problems with the installation, go to the program website. Site
As a result, we get a tool for mass mailing with a limit on the use of your Gmail account - 500 emails per day. It is advisable not to use the maximum limit due to the risk of getting a ban.
This is how our documents look:

Figure 2: Sheet Types
1. - sheet “Data”; 2. - sheet “FormEmailer”; 3. - sheet “05/2012”; 4. - sheet “Report”.
When creating, from Install you will get 2 tabs:
1) Data is our base. You will use this document as a mailing list.
2) FormEmailer - template and basic mailing settings.
We create another sheet - “Report”, and we will create a sheet of the archive using the program. All dispatch reports will be collected.
So, let's get down to bringing the FormEmailer-a script for you. Version does not matter.
Open the script editor, open the code FormEmailera.
Use Ctrl + F to find the function processManually and enter our code before it.
In order for everything to work, it is necessary that the code be the same as mine.
This code will add to our document an archive sheet with the name of the current month and year in the form “05/2012” - month / year.
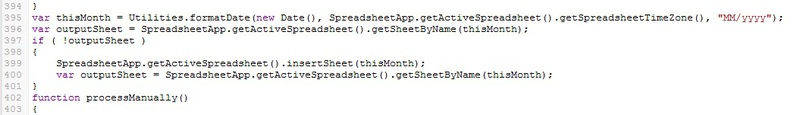
var thisMonth = Utilities.formatDate(new Date(), SpreadsheetApp.getActiveSpreadsheet().getSpreadsheetTimeZone(), "MM/yyyy"); var outputSheet = SpreadsheetApp.getActiveSpreadsheet().getSheetByName(thisMonth); if ( !outputSheet ) { SpreadsheetApp.getActiveSpreadsheet().insertSheet(thisMonth); var outputSheet = SpreadsheetApp.getActiveSpreadsheet().getSheetByName(thisMonth); } We add the counter of the sent letters.
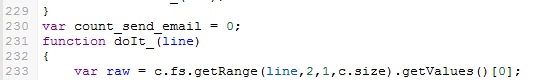
var count_send_email = 0; Create a cell in the columns with the date and copy to the archive for reference and comment on the text that is responsible for the statistical data.

var thisDate_send_email = Utilities.formatDate(new Date(), SpreadsheetApp.getActiveSpreadsheet().getSpreadsheetTimeZone(), "MM/dd/yyyy"); var time_send_email = Utilities.formatDate(new Date(), SpreadsheetApp.getActiveSpreadsheet().getSpreadsheetTimeZone(), "MM/dd/yyyy hh:mm:ss"); c.fs.getRange(line,1).setValue("Email sent, " + time_send_email); c.fs.getRange(line,2).setValue(thisDate_send_email); var dataHeight = c.fs.getDataRange().getHeight(); var dataWidth = c.fs.getDataRange().getWidth(); // Check if there free rows in the output sheet if(outputSheet.getDataRange().getHeight()==outputSheet.getMaxRows()) outputSheet.insertRowAfter(outputSheet.getMaxRows()); Logger.log("height:"+outputSheet.getDataRange().getHeight()); Logger.log("max: "+outputSheet.getMaxRows()) count_send_email++; c.fs.getRange(line, 1, 1, dataWidth).moveTo(outputSheet.getRange(outputSheet.getDataRange().getHeight()+1, 1)); c.fs.deleteRow(line); } catch(e) { status.push(repl_(T.statusError, s.qtt == 1 ? '' : i+1, e)); c.err.push(repl_(T.mailError, s.qtt == 1 ? '' : i+1, e, line)); } } else { status.push(T.statusQuota); if( c.err.length == 0 || !startsWith_(c.err[c.err.length-1], T.statusQuota) ) c.err.push(t.statusQuota+'. '+new Date()); break; } } outputSheet.getRange(outputSheet.getLastRow(),5).setValue(count_send_email); /* c.fs.getRange(line,1).setValue(status.join('; ')); if( c.fl && line != 2 ) { if( s.closure === 'values' ) all.setValues([values]); else if( s.closure === 'clear' ) all.clearContent(); //else formulas > just leave them there }*/ We will not go into the details of writing the script.
If you have any questions, write - answer.
This completes the refinement of FormEmailer.
We start the statistics.
Create a file where statistics will be collected.
Next, we need to ensure that the “Report” summary table is copied into the summary document Statistics
To do this, create a new updateData function in the FormEmailera script.
At the end of the code, approximately on line 1164, after the closing bracket of the previous function, add the following:
var SOURCE_SPREADSHEET_ID = " , "; var SOURCE_SHEET_NAME = " "; var DESTINATION_SPREADSHEET_ID = " , "; var DESTINATION_SHEET_NAME = " , "; function updateData() { try { var sourceSheet = SpreadsheetApp.openById(SOURCE_SPREADSHEET_ID).getSheetByName(SOURCE_SHEET_NAME); if(sourceSheet!=null) { var sourceData = SpreadsheetApp.getActiveSpreadsheet().getSheetByName(SOURCE_SHEET_NAME).getDataRange().getValues(); var destinSheet = SpreadsheetApp.openById(DESTINATION_SPREADSHEET_ID).getSheetByName(DESTINATION_SHEET_NAME); if(destinSheet!=null) destinSheet.getRange(1, 1, sourceData.length, sourceData[0].length).setValues(sourceData); else throw new Error("Destination sheet not found."); } else throw new Error("Source sheet not found."); } catch(e) { Logger.log(e.message); Browser.msgBox(Logger.getLog()); } } In order for our summary statistics sheet to become final, we will write the formulas for collecting the number of category letters sent / waiting to be sent.
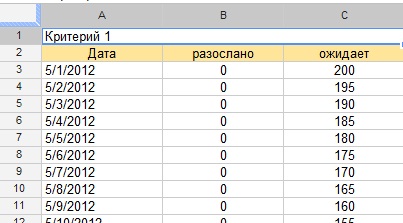
SENT:
= (ARRAYFORMULA (SUMIF ('05 / 2012 '! $ B: $ B, $ A2, '05 / 2012'! $ E: $ E)))
Decipher the formula:
ARRAYFORMULA — Array-in-a-cell formulas allow you to write formulas using array input, rather than output data.
SUMIF - Amount (range; criteria; total_range)
range - page 05/2012 column B, the $ sign reinforces this column when the formula is propagated by “pull down” (that is, each cell will have a range of $ B: $ B; $ B: $ B; $ B: $ B if if $ were not, it would be like this: B: B; C: C; D: D. (in this case, this is the date).
$ A2 is the criterion by which summation should be carried out, in our case it is 5/1/2012, and so on.
IMPORTANT: in order for you to have all the calculations correct, the type of criteria you are looking for must be the same. That is, if you select on 5/1/2012, it is not the same as 1/5/2012, MM / DD / YYYY is not equal to DD / MM / YYYY.
total_range - '05 / 2012 '! $ E: $ E is the column where calculations should be made (in our case, this is the number of letters).
WAITING:
= COUNTIF ('Data'! C: C, "* @ *")
decipher the formula - READ IF (In the C column of the “Data” sheet there is a text with the contents of @)
more about formulas
List of Google Spreadsheets features
There is one problem - if we write our formula in all columns, then we get the same number in all columns, and we need a real number tied to the date.
In order to correctly process waiting letters, it is necessary to bind the number to the date and, when working with the formula, leave only the resulting value. The code below solves this problem.

var thisDay = Utilities.formatDate(new Date(), SpreadsheetApp.getActiveSpreadsheet().getSpreadsheetTimeZone(), "dd"); var myArray_Date = new Array(); myArray_Date = [1,2,3,4,7,8,9,10,11,14,15,16,17,18,21,22,23,24,25,28,29,30,31]; var dataSheet = SpreadsheetApp.getActiveSpreadsheet().getSheetByName("Report"); for (var date_count = 0; date_count < 30; date_count++) { if (myArray_Date[date_count]==thisDay) { var y = myArray_Date[date_count] + 1; dataSheet.getRange(y, 3).setFormula("=COUNTIF('Date'!C:C, \"*@*\")"); } } var datatocopy = dataSheet.getRange(y, 3).getValues(); dataSheet.getRange(y, 3).setValues(datatocopy); Now we will start forming statistics.
We have a document for generating statistics, but in order to form it completely, not one such document is necessary, but several.
But for the time being we will proceed only from one document that we have.
For the formation of using the formula.
Create a page for the total count.
Figure 3. Statistics that we wanted to see.
In order to speed up the work, we will write a script to collect data from our two sheets.
function myFunction() { var workSheet = SpreadsheetApp.getActiveSpreadsheet().getSheetByName("REPORT"); var rew; var myReport_Name = new Array(); var first_work_row = 3, last_work_row = 33, count_column = 2; workSheet.getRange("B" + first_work_row + ":F" + last_work_row).clearContent(); for (var i=first_work_row; i<=last_work_row; i++) { rew = i - 1; workSheet.getRange(i, 2).setFormula("=(ARRAYFORMULA(SUMIF(' '!$A:$A&' '!$A$1; $A" + i + "&$B$1; ' '!B:B)))"); workSheet.getRange(i, 3).setFormula("=(ARRAYFORMULA(SUMIF(' '!$A:$A&' '!$A$1; $A" + i + "&$B$1; ' '!C:C)))"); workSheet.getRange(i, 4).setFormula("=Report_!F" + rew); workSheet.getRange(i, 5).setFormula("=Report_!E" + rew); workSheet.getRange(i, 6).setFormula("=Report_!D" + rew); } } In order for the menu to have a button, we add a small code:
function onOpen() { SpreadsheetApp.getActiveSpreadsheet().addMenu("?", [{name: "!", functionName: "myFunction"}]); } Now you do not need to enter the script every time you need to make a calculation. Just click on the “Dig” button and wait for the result.
To automate the process of starting a script, you can also use triggers that are configured in the script editor (Resources - Trigerras of the current script).
Such a table should appear, click on the “Add” link and set the following parameters.

Now the script will run automatically without your participation every 2 hours. You can customize in different ways.
You can write formulas manually, but when you have more than one sheet, but 20 or more, you can easily make a mistake when compiling the same formulas.
The only thing missing in our script is the “only values” parameter, which is necessary in order not to load the document with formulas.
Table with account and criteria - Account
Pivot table - Pivot
The only disadvantage of this statistic is the need to enter dates manually. If someone offers to automate the process of putting a date, excluding weekends, we will be grateful for your help.
That's all that we could tell you about the organization of statistics with online access.
Use files, learn, share links with friends.
We are waiting for your feedback.
Sincerely, Anton.
Source: https://habr.com/ru/post/144880/
All Articles