User identification by voice
Continuing the topic of voice recognition , I want to share my old thesis, on which at one time I pin my hopes on bringing to a commercial product, but then left this project, putting it on the network to the delight of other students. Although perhaps this topic will be interesting not only in academic terms, but also for general development.
The topic of my thesis was “Development of a CAD subsystem for protection against unauthorized access based on neural network analysis of the spectral characteristics of voice”. Of course, the diploma itself has a lot of water like TB, economics and other things, but there is also a mathematical and practical part, as well as an analysis of existing similar solutions. At the end lay out the program and the diploma itself, maybe someone else will come in handy.
So why do you need it at all?
The main way to personalize a user is to specify his network name and password. The dangers associated with the use of a password are well known: they forget passwords, keep them in the wrong place, and finally, they can simply be stolen. Some users write the password on paper and keep these records next to their workstations. According to information technology groups of many companies, most of the calls to the support service are associated with forgotten or invalid passwords.
The method of operation of existing systems.
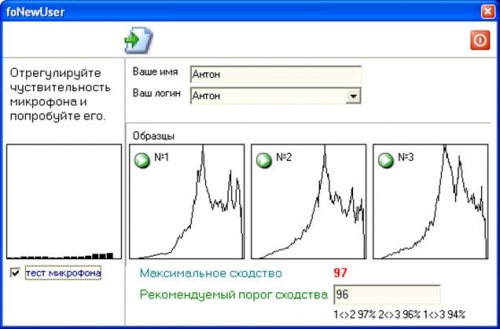
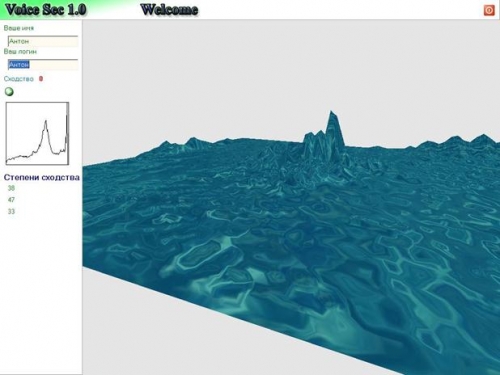
Most biometric security systems function as follows: a digital fingerprint, iris or voice is stored in the system database. A person intending to access a computer network using a microphone, fingerprint scanner, or other device enters information about himself into the system. Received data is compared with the sample stored in the database.
')
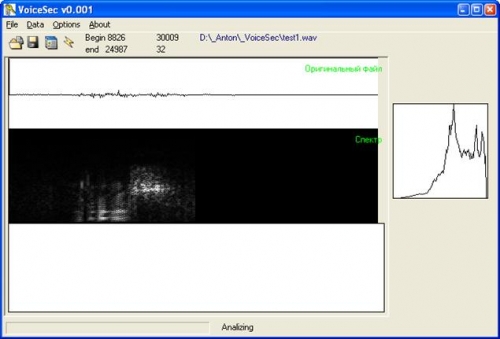
When a sample is recognized, a process is carried out, the first step of which is the initial transformation of the input information in order to reduce the processed volume so that it can be analyzed. The next stage is the spectral representation of speech, obtained by the Fourier transform. Spectral representation is achieved by using wide-frequency analysis of the recording.
Although the spectral representation of speech is very useful, it must be remembered that the signal being studied is very diverse.
Variety arises for many reasons, including:
- differences of human voices;
- Speaker's speech level;
- variations in pronunciation;
- normal variation of the movement of articulators (tongue, lips, jaw, palate).
Then the final output parameters for varying the voice are determined and normalization is performed to compile a scale of parameters, as well as to determine the situational level of speech. The above changed parameters are then used to create a template. The template is included in the dictionary, which characterizes the pronunciation of sounds in the transmission of information to the speaker using this system. Further, in the process of recognizing new speech patterns (already normalized and received their parameters), these patterns are compared with the patterns already available in the database using dynamic distortion and similar metric measurements.
The ability to use neural networks to build a speech recognition system
Any speech signal can be represented as a vector in any parametric space, then this vector can be stored in the neural network. One of the neural network models that study without a teacher is a Kohonen self-organizing map of features. In it, for a variety of input signals, neural ensembles are formed, representing these signals. This algorithm has the ability to statistical averaging, i.e. The problem with speech variability is solved. Like many other neural network algorithms, it performs parallel processing of information, i.e. all neurons work simultaneously. Thus, the problem with the recognition speed is solved - usually the operation time of a neural network is several iterations.
The practical work of the algorithm used
The process of comparing samples consists of the following stages:
- noise filtering;
- spectral conversion of the signal;
- post-filtering spectrum;
- lifting;
- the imposition of the Kaiser window;
- comparison.
Noise filtering
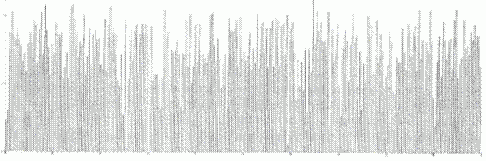
The sound produced by oscillations of the entire frequency range, similar to that whose spectrum is shown in the figure, is called noise.
In order to get a clear spectral characteristics of the sound they need to be cleaned of unnecessary noise.
The input discrete sound signal is processed by filters in order to get rid of the noise arising from the recording by the formula.

where Xi is a set of discrete values of the audio signal.
After processing in the signal, the beginning and end of the recording are searched for, and since the noise is already filtered out, the beginning of the fragment will be characterized by a burst of the signal, if you search with X0. Accordingly, if we look down from Xn, then a surge will characterize the end of the fragment. Thus, we obtain the beginning and end of the fragment in the array of discrete values of the signal. In a non-mathematical form, this means that we have found the word spoken by the user in the microphone, which needs to be averaged with other characteristics of the voice.
In addition to the pitch, the person feels another characteristic of the sound - the volume. The physical quantities most closely corresponding to loudness are shock pressure (for sounds in the air) and amplitude (for digital or electronic representation of sound).
If we talk about the digitized signal, the amplitude is the value of the sample. Analyzing millions of discrete values of the level of the same sound, we can say about the peak amplitude, that is, the absolute value of the maximum of the obtained discrete values of the sound level. To avoid distortion caused by distortion of the signal in digital audio recording (this distortion occurs when the magnitude of the peak amplitude exceeds the limits defined by the data storage format), it is necessary to pay attention to the magnitude of the peak amplitude. At the same time it is necessary to keep the signal-to-noise ratio at the maximum achievable level.
The main reason for the different loudness of sounds is the different pressure they exert on the ears. It can be said that pressure waves have different power levels. Waves that carry more power, with greater force affect the mechanism of the ears. Electrical signals that go through the wires also transmit power. By wire, sound is usually transmitted in the form of alternating voltage, and the instantaneous power of this sound is proportional to the square of the voltage. To determine the total power over a period of time, it is necessary to sum up all the values of the instantaneous power for this period.
In the language of mathematics, this is described by the integral where
where  - this is the voltage at a given point in time.
Since you are using sound represented by discrete values, you do not need to take an integral. It is enough just to add squares of readings. The average value of squares of discrete values is proportional to the average power.
Since the instantaneous power depends on the square of the instantaneous amplitude, it makes sense to choose in a similar way a similar relationship between the average amplitude and the average power. The way in which this can be done is to determine the average amplitude (RMS). Instead of calculating the mean value directly of the amplitude, we first square the values obtained, calculate the mean value of the resulting set, and then extract the root from it. The RMS method is used when it is necessary to calculate the average for a rapidly changing value. Algebraically, this is expressed in the following way: let us have N values and x (i) is the amplitude of the i-th discrete value. Then the RMS amplitude =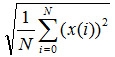
Power is proportional to the squared discrete value. This means that in order to switch to real power, this value must be multiplied by a certain factor. This does not require accurate data of electric power, so that, in fact, we are not interested in exact numbers, rather relative power.
Relative power is measured in Bel, and more often in decibels (dB, decibel, this is one tenth of Bel). To compare two sounds, the ratio of their power is taken. The decimal logarithm of this relationship is the difference in white; If we multiply the resulting number by ten, we get the value in decibels. For example, if the power of one signal exceeds the power of the other two times, then the first signal will be louder by 10 lg10 (2) = 3.01 dB.
Spectral signal transform
Since any sound is decomposed into sinusoidal waves, we can construct a frequency spectrum of sound. The frequency spectrum of the sound wave is a graph of amplitude versus frequency.
Phase changes often occur due to time delays. For example, each cycle of a 1000 Hz signal takes 1/1000 seconds. If you delay the signal for 1/2000 seconds (half cycle), you get a 180-degree shift in phase. Note that this effect relies on the relationship between frequency and time delay. If the signal at 250 Hz is delayed for the same 1/2000 seconds, then a 45-degree phase shift will be realized.
If you add together two sinusoidal waves of the same frequency, you get a new sinusoidal wave of the same frequency. This will be true even if the two source signals have different amplitudes and phases. For example, Asin (2 Pi ft) and Bcos (2 Pi ft) are two sinusoids with different amplitudes and phases, but I c with the same frequency.
To measure the amplitude of a single frequency, you need to multiply the existing signal by a sinusoid of the same frequency and add the resulting samples.
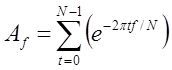
To write this in symbolic form, suppose that the samples have the values s0, s1, ..., st, .... The variable t is the count number (which replaces the time value). The amplitude of frequency f is measured in the first approximation, when calculating the following sum:
The values of t and f do not correspond exactly to the time and frequency. Moreover, f is an integer, and the real frequency under study is the sampling frequency multiplied by f / N. Similarly, t is an integer reference number. In addition, summation does not give an immediate value of the amplitude, but only a number proportional to the amplitude.
If we repeat these calculations for different values of f, then we can measure the amplitude of all frequencies in the signal. For any integer f less than N, the value f is easily determined, representing the amplitude of the corresponding frequency as a fraction of the total signal. These values can be calculated using the same formula:
If we know the values of Af we can restore the samples. To restore the signal, it is necessary to add all the values for different frequencies. In order to perform an exact inverse Fourier transform, in addition to amplitude and frequency, it is necessary to measure the phase of each frequency.
For this we need complex numbers. You can change the previously described method of calculation so that it will give a two-dimensional result. A simple Komi lex number is a two-dimensional value; therefore, it simultaneously represents both amplitude and phase.
With this approach, the phase part is calculated implicitly. Instead of amplitude and phase, two amplitudes are measured, corresponding to different phases. One of these phases is represented by cosine (cs ()), the other by sine sin ()).
Using complex numbers, you can measure at the same time, multiplying the sinus part by -i.

Each value of Af is now represented by a complex number; the real and imaginary parts set the amplitude of two sinusoidal waves with different phases.
The basic idea of the fast Fourier transform is that each second sample can be used to obtain a half spectrum. Formally, this means that the formula for the discrete Fourier transform can be represented as two sums. The first one contains all the even components of the original, the second one contains all the odd ones.

Spectrum filtering.
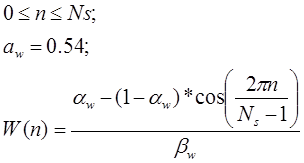
Having received a spectral representation of a signal, it is required to clean it of noise. The human voice has certain characteristics, and therefore those areas that cannot be voice characteristics need to be extinguished. For this, we apply a function called the Kaiser window.


After filtering the spectrum, we impose a Hanning window.
Comparison with reference samples in the database
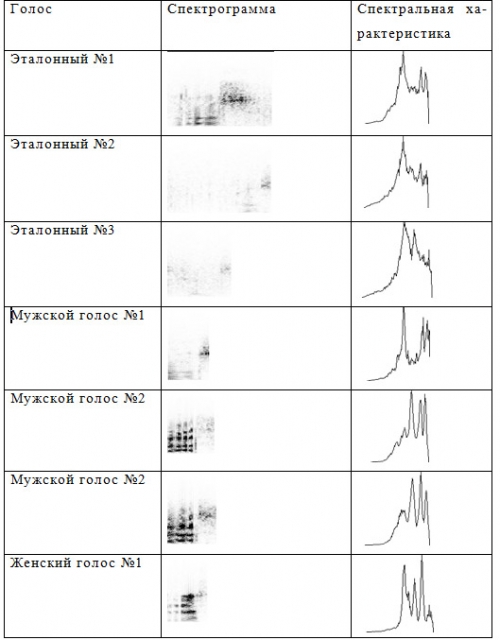
The main parameter used for identification is the measure of similarity of two sound bites. To calculate it, it is necessary to compare the spectrograms of these fragments. In this case, the spectra obtained in a separate window are first compared, and then the calculated values are averaged.
To compare the two fragments, the following approach was used:
Suppose that X [1..N] and Y [1..N] are arrays of numbers of the same size N, containing the values of the spectral power of the first and second fragments, respectively. Then the measure of similarity between them is calculated by the following formula:
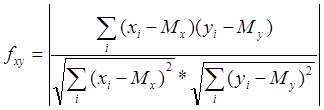
where Mx and My are the expectations for arrays X [] and Y [], respectively, calculated by the following formula:

This method of calculating the measure of similarity of two fragments presented in the form of a spectrum is the most optimal for the task of identifying a person by his voice.
Neural network comparison based on simple perceptrons
Despite the large variety of neural network options, they all have common features. So, all of them, as well as the human brain, consist of a large number of interconnected homogeneous elements - neurons that mimic the neurons of the brain. The figure shows a diagram of a neuron.

The figure shows that, like a living neuron, an artificial neuron consists of synapses connecting the inputs of the neuron with the nucleus; nucleus of the neuron, which processes the input signals and the axon, which connects the neuron with the neurons of the next layer. Each synapse has a weight that determines how the corresponding input of the neuron affects its state. The state of the neuron is determined by the formula
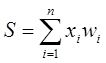
where n is the number of inputs of the neuron, xi is the value of the i-th input of the neuron, wi is the weight of the i-th synapse
Then the value of the neuron's axon is determined by the formula: Y = f (S) where f is a certain function, which is called activation. Most often, the so-called sigmoid is used as the activation function, which has the following form:

The main advantage of this function is that it is differentiable on the entire abscissa axis and has a very simple derivative:

As α decreases, the sigmoid becomes flatter, degenerating into a horizontal line at a level of 0.5 with α = 0. As a increases, a sigmoid approaches the unit jump function more and more.
Network training
For the automatic functioning of the system, the method of teaching the network without a teacher was chosen. Teaching without a teacher is a much more plausible model of learning in a biological system. Developed by Kohonen and many others, it does not need a target vector for exits and, therefore, does not require comparison with predetermined ideal answers. The training set consists only of input vectors. The learning algorithm adjusts the weights of the network so that consistent output vectors are obtained, that is, the presentation of sufficiently close input vectors gives the same outputs.
Perceptron is trained by submitting multiple images one at a time to its input and adjusting the weights until the required output is reached for all the images. Suppose that the input images are applied to demo maps. Each map is divided into squares and an input is given from each square to the perceptron. If there is a line in the square, then one is sent from it, otherwise zero. The set of squares on the map thus defines the set of zeros and ones, which is fed to the inputs of the perceptron. The goal is to teach the perceptron to turn on the indicator when applying to it a set of inputs defining an odd number, and not to turn it on if it is even.
For network training, the image of X is input and the output of Y is calculated. If Y is correct, then nothing changes. However, if the output is incorrect, then the weights attached to the inputs that amplify the erroneous result are modified to reduce the error.
The information content of different parts of the spectrum is not the same: there is more information in the low-frequency region than in the high-frequency region. Therefore, to prevent unnecessary consumption of the neural network inputs, it is necessary to reduce the number of elements that receive information from the high-frequency region, or, equivalently, compress the high-frequency region of the spectrum in frequency space.
The most common method is logarithmic compression.
where f is the frequency in the Hz spectrum, m is the frequency in the new compressed frequency space
Such a transformation makes sense only if the number of elements at the input of the NI neural network is less than the number of elements of the spectrum NS.
After normalization and compression, the spectrum is superimposed on the input of the neural network. The input of a neural network is a linearly ordered array of elements that are assigned the levels of the corresponding frequencies in the spectrum. These elements do not perform any crucial functions, but only transmit signals further to the neural network. Choosing the number of inputs is a difficult task, because with a small size of the input vector, information important for recognition can be lost, and with a large, the complexity of calculations increases significantly (when simulating on a PC, in real neural networks this is not true, since all elements work in parallel).
With a large resolution (number) of inputs, it is possible to isolate the harmonic structure of speech and, as a consequence, determine the pitch of the voice. At low resolution (number of inputs), only the formant structure can be determined.
Further investigation of this problem showed that for recognition only information about the formant structure is sufficient. In fact, a person equally recognizes normal voice and whisper, although the latter lacks a voice source. ( ), . , 50~100.
, . , . , .
8 . , , , .
6 2 . , . , . , …
, . . . , , , . . .
. . , . , .
, .
, ,
The topic of my thesis was “Development of a CAD subsystem for protection against unauthorized access based on neural network analysis of the spectral characteristics of voice”. Of course, the diploma itself has a lot of water like TB, economics and other things, but there is also a mathematical and practical part, as well as an analysis of existing similar solutions. At the end lay out the program and the diploma itself, maybe someone else will come in handy.
So why do you need it at all?
The main way to personalize a user is to specify his network name and password. The dangers associated with the use of a password are well known: they forget passwords, keep them in the wrong place, and finally, they can simply be stolen. Some users write the password on paper and keep these records next to their workstations. According to information technology groups of many companies, most of the calls to the support service are associated with forgotten or invalid passwords.
The method of operation of existing systems.
Most biometric security systems function as follows: a digital fingerprint, iris or voice is stored in the system database. A person intending to access a computer network using a microphone, fingerprint scanner, or other device enters information about himself into the system. Received data is compared with the sample stored in the database.
')
When a sample is recognized, a process is carried out, the first step of which is the initial transformation of the input information in order to reduce the processed volume so that it can be analyzed. The next stage is the spectral representation of speech, obtained by the Fourier transform. Spectral representation is achieved by using wide-frequency analysis of the recording.
Although the spectral representation of speech is very useful, it must be remembered that the signal being studied is very diverse.
Variety arises for many reasons, including:
- differences of human voices;
- Speaker's speech level;
- variations in pronunciation;
- normal variation of the movement of articulators (tongue, lips, jaw, palate).
Then the final output parameters for varying the voice are determined and normalization is performed to compile a scale of parameters, as well as to determine the situational level of speech. The above changed parameters are then used to create a template. The template is included in the dictionary, which characterizes the pronunciation of sounds in the transmission of information to the speaker using this system. Further, in the process of recognizing new speech patterns (already normalized and received their parameters), these patterns are compared with the patterns already available in the database using dynamic distortion and similar metric measurements.
The ability to use neural networks to build a speech recognition system
Any speech signal can be represented as a vector in any parametric space, then this vector can be stored in the neural network. One of the neural network models that study without a teacher is a Kohonen self-organizing map of features. In it, for a variety of input signals, neural ensembles are formed, representing these signals. This algorithm has the ability to statistical averaging, i.e. The problem with speech variability is solved. Like many other neural network algorithms, it performs parallel processing of information, i.e. all neurons work simultaneously. Thus, the problem with the recognition speed is solved - usually the operation time of a neural network is several iterations.
The practical work of the algorithm used
The process of comparing samples consists of the following stages:
- noise filtering;
- spectral conversion of the signal;
- post-filtering spectrum;
- lifting;
- the imposition of the Kaiser window;
- comparison.
Noise filtering
The sound produced by oscillations of the entire frequency range, similar to that whose spectrum is shown in the figure, is called noise.
In order to get a clear spectral characteristics of the sound they need to be cleaned of unnecessary noise.
The input discrete sound signal is processed by filters in order to get rid of the noise arising from the recording by the formula.
where Xi is a set of discrete values of the audio signal.
After processing in the signal, the beginning and end of the recording are searched for, and since the noise is already filtered out, the beginning of the fragment will be characterized by a burst of the signal, if you search with X0. Accordingly, if we look down from Xn, then a surge will characterize the end of the fragment. Thus, we obtain the beginning and end of the fragment in the array of discrete values of the signal. In a non-mathematical form, this means that we have found the word spoken by the user in the microphone, which needs to be averaged with other characteristics of the voice.
In addition to the pitch, the person feels another characteristic of the sound - the volume. The physical quantities most closely corresponding to loudness are shock pressure (for sounds in the air) and amplitude (for digital or electronic representation of sound).
If we talk about the digitized signal, the amplitude is the value of the sample. Analyzing millions of discrete values of the level of the same sound, we can say about the peak amplitude, that is, the absolute value of the maximum of the obtained discrete values of the sound level. To avoid distortion caused by distortion of the signal in digital audio recording (this distortion occurs when the magnitude of the peak amplitude exceeds the limits defined by the data storage format), it is necessary to pay attention to the magnitude of the peak amplitude. At the same time it is necessary to keep the signal-to-noise ratio at the maximum achievable level.
The main reason for the different loudness of sounds is the different pressure they exert on the ears. It can be said that pressure waves have different power levels. Waves that carry more power, with greater force affect the mechanism of the ears. Electrical signals that go through the wires also transmit power. By wire, sound is usually transmitted in the form of alternating voltage, and the instantaneous power of this sound is proportional to the square of the voltage. To determine the total power over a period of time, it is necessary to sum up all the values of the instantaneous power for this period.
In the language of mathematics, this is described by the integral
where - this is the voltage at a given point in time.Since you are using sound represented by discrete values, you do not need to take an integral. It is enough just to add squares of readings. The average value of squares of discrete values is proportional to the average power.
Since the instantaneous power depends on the square of the instantaneous amplitude, it makes sense to choose in a similar way a similar relationship between the average amplitude and the average power. The way in which this can be done is to determine the average amplitude (RMS). Instead of calculating the mean value directly of the amplitude, we first square the values obtained, calculate the mean value of the resulting set, and then extract the root from it. The RMS method is used when it is necessary to calculate the average for a rapidly changing value. Algebraically, this is expressed in the following way: let us have N values and x (i) is the amplitude of the i-th discrete value. Then the RMS amplitude =
Power is proportional to the squared discrete value. This means that in order to switch to real power, this value must be multiplied by a certain factor. This does not require accurate data of electric power, so that, in fact, we are not interested in exact numbers, rather relative power.
Relative power is measured in Bel, and more often in decibels (dB, decibel, this is one tenth of Bel). To compare two sounds, the ratio of their power is taken. The decimal logarithm of this relationship is the difference in white; If we multiply the resulting number by ten, we get the value in decibels. For example, if the power of one signal exceeds the power of the other two times, then the first signal will be louder by 10 lg10 (2) = 3.01 dB.
Spectral signal transform
Since any sound is decomposed into sinusoidal waves, we can construct a frequency spectrum of sound. The frequency spectrum of the sound wave is a graph of amplitude versus frequency.
Phase changes often occur due to time delays. For example, each cycle of a 1000 Hz signal takes 1/1000 seconds. If you delay the signal for 1/2000 seconds (half cycle), you get a 180-degree shift in phase. Note that this effect relies on the relationship between frequency and time delay. If the signal at 250 Hz is delayed for the same 1/2000 seconds, then a 45-degree phase shift will be realized.
If you add together two sinusoidal waves of the same frequency, you get a new sinusoidal wave of the same frequency. This will be true even if the two source signals have different amplitudes and phases. For example, Asin (2 Pi ft) and Bcos (2 Pi ft) are two sinusoids with different amplitudes and phases, but I c with the same frequency.
To measure the amplitude of a single frequency, you need to multiply the existing signal by a sinusoid of the same frequency and add the resulting samples.
To write this in symbolic form, suppose that the samples have the values s0, s1, ..., st, .... The variable t is the count number (which replaces the time value). The amplitude of frequency f is measured in the first approximation, when calculating the following sum:
The values of t and f do not correspond exactly to the time and frequency. Moreover, f is an integer, and the real frequency under study is the sampling frequency multiplied by f / N. Similarly, t is an integer reference number. In addition, summation does not give an immediate value of the amplitude, but only a number proportional to the amplitude.
If we repeat these calculations for different values of f, then we can measure the amplitude of all frequencies in the signal. For any integer f less than N, the value f is easily determined, representing the amplitude of the corresponding frequency as a fraction of the total signal. These values can be calculated using the same formula:
If we know the values of Af we can restore the samples. To restore the signal, it is necessary to add all the values for different frequencies. In order to perform an exact inverse Fourier transform, in addition to amplitude and frequency, it is necessary to measure the phase of each frequency.
For this we need complex numbers. You can change the previously described method of calculation so that it will give a two-dimensional result. A simple Komi lex number is a two-dimensional value; therefore, it simultaneously represents both amplitude and phase.
With this approach, the phase part is calculated implicitly. Instead of amplitude and phase, two amplitudes are measured, corresponding to different phases. One of these phases is represented by cosine (cs ()), the other by sine sin ()).
Using complex numbers, you can measure at the same time, multiplying the sinus part by -i.
Each value of Af is now represented by a complex number; the real and imaginary parts set the amplitude of two sinusoidal waves with different phases.
The basic idea of the fast Fourier transform is that each second sample can be used to obtain a half spectrum. Formally, this means that the formula for the discrete Fourier transform can be represented as two sums. The first one contains all the even components of the original, the second one contains all the odd ones.
Spectrum filtering.
Having received a spectral representation of a signal, it is required to clean it of noise. The human voice has certain characteristics, and therefore those areas that cannot be voice characteristics need to be extinguished. For this, we apply a function called the Kaiser window.
After filtering the spectrum, we impose a Hanning window.
Comparison with reference samples in the database
The main parameter used for identification is the measure of similarity of two sound bites. To calculate it, it is necessary to compare the spectrograms of these fragments. In this case, the spectra obtained in a separate window are first compared, and then the calculated values are averaged.
To compare the two fragments, the following approach was used:
Suppose that X [1..N] and Y [1..N] are arrays of numbers of the same size N, containing the values of the spectral power of the first and second fragments, respectively. Then the measure of similarity between them is calculated by the following formula:
where Mx and My are the expectations for arrays X [] and Y [], respectively, calculated by the following formula:
This method of calculating the measure of similarity of two fragments presented in the form of a spectrum is the most optimal for the task of identifying a person by his voice.
Neural network comparison based on simple perceptrons
Despite the large variety of neural network options, they all have common features. So, all of them, as well as the human brain, consist of a large number of interconnected homogeneous elements - neurons that mimic the neurons of the brain. The figure shows a diagram of a neuron.
The figure shows that, like a living neuron, an artificial neuron consists of synapses connecting the inputs of the neuron with the nucleus; nucleus of the neuron, which processes the input signals and the axon, which connects the neuron with the neurons of the next layer. Each synapse has a weight that determines how the corresponding input of the neuron affects its state. The state of the neuron is determined by the formula
where n is the number of inputs of the neuron, xi is the value of the i-th input of the neuron, wi is the weight of the i-th synapse
Then the value of the neuron's axon is determined by the formula: Y = f (S) where f is a certain function, which is called activation. Most often, the so-called sigmoid is used as the activation function, which has the following form:
The main advantage of this function is that it is differentiable on the entire abscissa axis and has a very simple derivative:
As α decreases, the sigmoid becomes flatter, degenerating into a horizontal line at a level of 0.5 with α = 0. As a increases, a sigmoid approaches the unit jump function more and more.
Network training
For the automatic functioning of the system, the method of teaching the network without a teacher was chosen. Teaching without a teacher is a much more plausible model of learning in a biological system. Developed by Kohonen and many others, it does not need a target vector for exits and, therefore, does not require comparison with predetermined ideal answers. The training set consists only of input vectors. The learning algorithm adjusts the weights of the network so that consistent output vectors are obtained, that is, the presentation of sufficiently close input vectors gives the same outputs.
Perceptron is trained by submitting multiple images one at a time to its input and adjusting the weights until the required output is reached for all the images. Suppose that the input images are applied to demo maps. Each map is divided into squares and an input is given from each square to the perceptron. If there is a line in the square, then one is sent from it, otherwise zero. The set of squares on the map thus defines the set of zeros and ones, which is fed to the inputs of the perceptron. The goal is to teach the perceptron to turn on the indicator when applying to it a set of inputs defining an odd number, and not to turn it on if it is even.
For network training, the image of X is input and the output of Y is calculated. If Y is correct, then nothing changes. However, if the output is incorrect, then the weights attached to the inputs that amplify the erroneous result are modified to reduce the error.
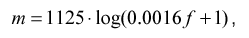
The information content of different parts of the spectrum is not the same: there is more information in the low-frequency region than in the high-frequency region. Therefore, to prevent unnecessary consumption of the neural network inputs, it is necessary to reduce the number of elements that receive information from the high-frequency region, or, equivalently, compress the high-frequency region of the spectrum in frequency space.
The most common method is logarithmic compression.
where f is the frequency in the Hz spectrum, m is the frequency in the new compressed frequency space
Such a transformation makes sense only if the number of elements at the input of the NI neural network is less than the number of elements of the spectrum NS.
After normalization and compression, the spectrum is superimposed on the input of the neural network. The input of a neural network is a linearly ordered array of elements that are assigned the levels of the corresponding frequencies in the spectrum. These elements do not perform any crucial functions, but only transmit signals further to the neural network. Choosing the number of inputs is a difficult task, because with a small size of the input vector, information important for recognition can be lost, and with a large, the complexity of calculations increases significantly (when simulating on a PC, in real neural networks this is not true, since all elements work in parallel).
With a large resolution (number) of inputs, it is possible to isolate the harmonic structure of speech and, as a consequence, determine the pitch of the voice. At low resolution (number of inputs), only the formant structure can be determined.
Further investigation of this problem showed that for recognition only information about the formant structure is sufficient. In fact, a person equally recognizes normal voice and whisper, although the latter lacks a voice source. ( ), . , 50~100.
, . , . , .
8 . , , , .
6 2 . , . , . , …
, . . . , , , . . .
. . , . , .
, .
, ,
Source: https://habr.com/ru/post/144580/
All Articles