Building a birthday card with the help of Processing and VK API
Introduction
A few days ago, an entry was posted on The Daily Viz blog that caught the attention of the general public as an example of simple and effective data visualization.
The visualization was a birthday card, implemented as a heatmap in the form of a calendar. Vertically there were numbers, horizontally - months, and, looking at this simple table, we could judge how rich a particular day in a year was in terms of childbearing by the saturation of the hue.
After some time, the author of the visualization published a second post in the same blog, apologizing for misleading the community without commenting properly on the source data used in the work on the image. The problem was that the initial data set did not contain information on the real number of people born on a given day. The information was given in a different form - at what place (rank) is a particular day in the "rating" of the popularity of birthdays.
')
That is, the difference between the first and second position in the rating could be enormous (say, twice), but they would differ only by one tone anyway. In other words, the visualization did not reflect real data due to the fact that the set contained only derived data.
Having thought a bit about this problem, I decided to describe my own example of creating such a visualization from beginning to end - that is, from data collection to, in fact, drawing the image. This example is good because, on the one hand, it is relatively simple, and on the other, it is a complete, complete project with a certain interesting result.
For all operations, I used the Processing environment, which is traditionally used for such tasks (there is no need to dwell on the problem of choosing a tool).
So, the process of working on a project has a stable structure and consists of three stages:
data collection> data sorting> data visualization
We will follow this structure.
1. Data collection
We will extract data from the vk.com social network user profiles. Fortunately for us, some of the methods of its API are open and do not require application authorization, which greatly simplifies the task.
Experimentally, I found that these 100,000 profiles will be enough to level out random heterogeneities in the distribution of birthdays in the calendar and identify the main trends. However, to save time and demonstrate, we will collect 10,000 records. Later we will be able to substitute any number of profiles we need.
We will write the program inside the main setup () function. We do not need the draw () function, since the program generates a static image and does not contain animation. More information about the structure of the program at Processing can be found on the project website. There is also a description of all built-in functions and an excellent syntax reference.
In addition, we will not write a program that performs the task inside and out: it collects data, processes it and creates a visualization. We divide the “elephant” into several modules to make it easier to work and spend less time debugging and fixing errors. That is, we first write a program that collects data, collect data with it. Then separately we will write the program which on the basis of the saved collected data generates the required image.
So, we write a blank for the program.
void setup() { // exit(); // } Now we will understand how the VK API works. We access the server at a special URL containing the parameters of our request:
http://api.vk.com/method/users.get.xml/uids= There is a comma-separated list of id users we are interested in} & fields = {here is a list of the names of the user profile fields that interest us} If we write the name of the method without .xml, then we will receive a response from the server as a string in JSON format. This is one of the options, but in this example we will use XML. Suppose we want to get information from the account of Pavel Durov, the founder of vkontakte. Our address:
http://api.vk.com/method/users.get.xml?uids=1&fields=bdate
His profile Id - 1, the field of interest to us - his birthday - is called bdate .
Let's try to get information about this profile. We use the built-in function loadStrings () , which takes as a parameter a string with the address of the file of interest, and returns the contents of the file as an array of strings.
void setup() { String[] user = loadStrings("http://api.vk.com/method/users.get.xml?uids=1&fields=bdate"); // println(user); // ( ) exit(); // } After starting the program, our response from the server will appear in the console:
[0] "<?xml version="1.0" encoding="utf-8"?>" [1] "<response list="true">" [2] " <user>" [3] " <uid>1</uid>" [4] " <first_name></first_name>" [5] " <last_name></last_name>" [6] " <bdate>10.10.1984</bdate>" [7] " </user>" [8] "</response>" Numbers in square brackets indicate the record number (index) in the array and is not related to the contents of the array. Also, each line is enclosed in quotes. Actually, what is between the quotes is our content. We are interested in the field
<bdate>(line [6]). It contains the information we are interested in - the date of birth of the user # 1 in a clear format: the 10th of the 10th month (October) of 1984.
We agreed to collect 10,000 dates of birth. What are we doing? We iterate through the users' id from 1 to the number we need. The problem is that not all id have valid profiles and not all users open their date of birth. Thus, we need two counters: the first counter will count the users' id in order, and the second will count how many dates we really collected in order to stop in time. From experience, to score 10,000 dates, you need to sort out about 15,000 accounts.
We write a cycle:
void setup() { int count = 0; // for (int i = 1; count <= 10000; i++) { // id, , 10000 String[] user = loadStrings("http://api.vk.com/method/users.get.xml?uids=" + str(i) + "&fields=bdate"); // , id for (int j = 0; j < user.length; j++) { // if (user[j].indexOf("<bdate>") != -1) { // println(i + "\t" + count + "\t" + user[j]); // count++; // 1 } } } exit(); // } Notice that the value of counter i , when we substitute it into a string, is “wrapped” by the function str () . It is needed to convert the data type from number to string. Strictly speaking, the program will understand what we want from it even without this operation, but it’s better to take the habit of controlling things like transferring data from one type to another (automatic translation does not work in some situations).
When iterating through response lines, we use the indexOf () method, which returns the location of the string specified in the parameter in the line to which the method is applied. If there is no parameter string in our string, the method returns the value -1, which we use to check whether the current string is the one we need.
When we output the data we are interested in to the console, we will add additional information: the state of the counters to monitor the progress. The variable values in parentheses of the println () output function are separated by the string "\ t" , which means a tab character.
If we start the program now, we will see that the values of the counters quickly diverge. In my case, after searching 55 id, only 31 dates were collected.
So, it seems, everything is working fine, it remains only to make the program write data to the file as it is received. To do this, create an object of the PrintWriter class. It is declared as a regular variable, and as a rule it is immediately assigned the value of the createWriter function (file path) :
PrintWriter p = createWriter("data/bdates.txt"); In this case, we name the object “p”, associating a file to it with the address “folder-programs / data / bdates.txt”, which will allow us to write into this file what we need. How do we do it? The println () method can be applied to our object, which works in the same way as the function of the same name, but outputs the data not to the console, but to the specified file. It looks like this:
p.println(); After we have worked with our file, you need to correctly finish working with it, otherwise the information will not be recorded in it. This is done using this entry:
p.flush(); p.close(); These two functions are always used to correctly complete the work with the file together. Our program:
void setup() { PrintWriter p = createWriter("data/bdates.txt"); // int count = 0; // for (int i = 1; count <= 10000; i++) { // id, , 10000 String[] user = loadStrings("http://api.vk.com/method/users.get.xml?uids=" + str(i) + "&fields=bdate"); // , id for (int j = 0; j < user.length; j++) { // if (user[j].indexOf("<bdate>") != -1) { // p.println(user[j]); // println(count); // count++; // 1 } } } p.flush(); p.close(); // exit(); // } When collecting data, we refused to output the string value and the id counter to the console: outputting too much data to the console can sometimes slow down the program, so it’s best to limit yourself to what’s needed — a count of collected dates.
It would seem that still need? You can run the program! Yes and no. When polling a remote server, you should always keep in mind that sometimes the server does not respond. Imagine that we sent a request to the server, waiting for a response and do not receive it. After some time, the program will decide that the server is "lying" and simply continue to run. What will happen? After all, we did not receive user data, our array is empty. If the program accesses it, the program will issue an error message to the console and stop. This may not happen, but it may happen, and then you have to start the program again, wait and pray for the server to answer all 15,000 of our requests.
In order not to rely on blind fate, error handling was invented. Errors are processed using this entry:
try { // , } catch ( ) { // , , } Error Handling Program:
void setup() { PrintWriter p = createWriter("data/bdates.txt"); // int count = 0; // for (int i = 1; count <= 10000; i++) { // id, , 10000 String[] user = loadStrings("http://api.vk.com/method/users.get.xml?uids=" + str(i) + "&fields=bdate"); // , id try { for (int j = 0; j < user.length; j++) { // if (user[j].indexOf("<bdate>") != -1) { // p.println(user[j]); // println(count); // count++; // 1 } } } catch (Exception e) {} } p.flush(); p.close(); // exit(); // } Now, if an error occurs when accessing the array (if the array is empty), the code will be executed ... no code will be executed, the program will display an error message, but it will not stop. We simply ignore the error and move on - all we have to do is request information from another user. The type of error is set to Exception , which means that we “catch” any errors that occur. Writing e after the error type is required, because the program needs some kind of variable in which to write information about the error. We can refer to this variable when handling errors, but in this case it is not necessary.
2. Sort data
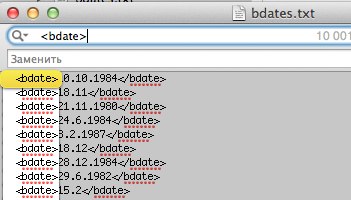
After some time (usually not more than half an hour) after launching the program, it will end and we will see the treasured number 10,000 on the console. This means that the data has been collected and you can start sorting. Open the file in a text editor and look at the result of our work:
What's wrong? Yeah, we completely forgot that we wrote data to the file along with the XML tags. No problem! In any text editor there is an autochange function, with which you can clean our file of unnecessary information. Strictly speaking, we could programmatically “catch” too much already at the stage of data collection, but in principle, for simplicity and to save time, it is not shameful to use any available tool.
After cleaning the file, save it and close it. Now the program will just read it.
3. Data Visualization
Now let's do the drawing. First we need to open the file and calculate how many users were born on each individual day. To open the file, use the old familiar function loadStrings () . In order to store the number of users born on a certain day, we use a two-dimensional array of natural numbers:
int[][] table = new int[12][31] We indicated an array size of 12 by 31. We have 12 months in a year and a maximum of 31 days. In theory, February 31 should not be born a single person, so we should not worry that the array for some months is too long.
How will our program work? We must take a date, determine which day and month it contains, and increase the corresponding array cell by one.
In order to split a string into day, month and year, we will use the split () method. It returns an array of strings, and takes as its argument a separator string: instruction
String[] s = "00010010".split("1"); assign s value to array
[0] "000" [1] "00" [2] "0" What does this mean for our practice? We take an array string and divide it with the dot character as a separator. There is one technical problem: the point symbol is reserved as a symbol of any character. Therefore, instead of "." as an argument we pass "\\." - such record designates the point symbol we need. It turns out like this:
void setup() { String[] file = loadStrings("data/bdates.txt"); // int[][] table = new int[12][31]; for (int i = 0; i < file.length; i++) { // String[] date = file[i].split("\\."); // , } exit(); // } Now the date [0] cell contains a line with the number of the day in the month, and the date [1] contains the number of the month. We need to increment the corresponding cell in the table array by one:
table[int(table[1])-1][int(table[0])-1]++; Specifying the cell address corresponding to the date, we translate the string into a number using the int () function, and also subtract one. Why take a unit? Then, that the counting of the cells of the array starts from zero. We specified a length of 12, which means that the cells of the array are numbered from 0 to 11. Unlike months, which are numbered from 1 to 12. This discrepancy must be remembered.
Right? That's right, but not quite. If you run the program now, it will generate an error. The fact is that our data set is not perfect. For some unknown reason, some users in the date of birth field are some obscene numbers like 666.666 or 32.13.888888888. Sometimes you can even meet a user who was born, for example, minus the fifth of December. To sort them, you need to discard the values of months greater than 12 and values of days greater than 31, as well as all values less than or equal to zero:
if ((int(date[1]) <= 12) && (int(date[1]) > 0) && (int(date[0]) <= 31) && (int(date[0]) > 0)) { // table[int(date[1])-1][int(date[0])-1]++; // 1 } Entire program:
void setup() { String[] file = loadStrings("data/bdates.txt"); // int[][] table = new int[12][31]; for (int i = 0; i < file.length; i++) { // String[] date = file[i].split("\\."); // , if ((int(date[1]) <= 12) && (int(date[1]) > 0) && (int(date[0]) <= 31) && (int(date[0]) > 0)) { // table[int(date[1])-1][int(date[0])-1]++; // 1 } } exit(); // } Now that the data is finally collected and stored in the program's memory, you can finally get down to creativity - drawing. First, we will define the color with which we will draw: I took the company blue VK color: RGB 54, 99, 142. Let's declare a color variable so as not to write three cherished numbers each time:
color c = color(54, 99, 142); We also need (by tradition, at the very beginning of the program) to decide how wide and high our image will be. To do this, we write the function:
size(, ); What we will have the width and height? Suppose each heatmap cell is 40 pixels wide, plus one pixel for the indentation between cells. Months set aside in width. Do not forget about the indent from the edge (10 pixels). It turns out 20 + 41 * 12. If you do not want to count in your mind or open a calculator application, you can simply write this expression as an argument to the println function (20 + 41 * 12); and get the answer - 512. This is the width of the image. Taking into account the cell height of 20 pixels and the same indent from the edge, we get:
size(512, 671); Now temporarily remove the exit () command; at the end of the program, so that we do not exit the program after completion, and run the code execution:
void setup() { size(512, 671); // background(255); // - String[] file = loadStrings("data/bdates.txt"); // int[][] table = new int[12][31]; for (int i = 0; i < file.length; i++) { // String[] date = file[i].split("\\."); // , if ((int(date[1]) <= 12) && (int(date[1]) > 0) && (int(date[0]) <= 31) && (int(date[0]) > 0)) { // table[int(date[1])-1][int(date[0])-1]++; // 1 } } color c = color(54, 99, 142); // } After specifying the frame size, I added the command to set the white background: if we specify the color with a single number, then it is recognized as shades of gray from 0 (black) to 255 (white). When starting the program, a window should open with a white background of the size we need.
Let's start, finally, to draw. How do we draw? We run over the table array - for each row (month) and in each row (day of this month) by cells. We draw in the right place and the right color rectangle 40 to 20. How is the position of X calculated? 10 (indent) + 41 (width + gap between) * i (month counter). Position Y? 10 (indent) + 21 (height + gap between) * j (days counter). The rectangle is drawn by the function rect (x, y, width, height); -
rect(10+41*i, 10+21*j, 40, 20); Program:
void setup() { size(512, 671); // background(255); // - String[] file = loadStrings("data/bdates.txt"); // int[][] table = new int[12][31]; for (int i = 0; i < file.length; i++) { // String[] date = file[i].split("\\."); // , if ((int(date[1]) <= 12) && (int(date[1]) > 0) && (int(date[0]) <= 31) && (int(date[0]) > 0)) { // table[int(date[1])-1][int(date[0])-1]++; // 1 } } color c = color(54, 99, 142); // for (int i = 0; i < table.length; i++) { // for (int j = 0; j < table[i].length; j++) { // rect(10+41*i, 10+21*j, 40, 20); // } } } If you run this code, we get a field that is strangely lined with rectangles with strokes. First we remove the stroke by adding the noStroke () command before drawing ; . Now set our color as a fill: fill (c);
Perfectly. Now the area is paved with beautiful blue tiles with white gaps. Next we need to somehow encode the values of the table in the fill color. We do this with transparency. Color transparency takes values from 0 to 255. Write fill (c, 10); gives a barely noticeable bluish tinge, and fill (c, 240); will give almost completely saturated blue color. So, the range of transparency - 0..255. The range of values in our array is much larger (or smaller). Suppose we know the maximum value in the array. The minimum, of course, will be zero. We need to somehow enter the value from the array into the range 0..255, as if to reduce (increase) the scale. For this there is a map function (value, the beginning of the source range, the end of the source range, the beginning of the new range, the end of the new range)
map(table[i][j], 0, 1000, 0, 255); Here we made the assumption that the maximum value of the array is 1000. Then, if the value of table [i] [j] is 1000, the function returns 255, and if the value is 0, it returns zero.
How to calculate the minimum and maximum values of a two-dimensional array? For a one-dimensional array, there are functions min () and max (), respectively. We use them. Run through the “months” cycle and compare the minimum and maximum value of each “month” (which is perceived by the environment as a one-dimensional array) with variables that store the current minimum or maximum value in the array. And let's not forget another important thing: sometimes there were incorrect dates in the data set, i.e. Someone could specify the date of birth November 31 or February 30. To prevent this fact from interfering with us, let us set the value of all non-existent dates to zero.
table[1][29] = 0; //30 table[1][30] = 0; //31 table[3][30] = 0; //31 table[5][30] = 0; //31 table[8][30] = 0; //31 table[10][30] = 0; //31 int mi = table[0][0]; // int ma = table[0][0]; // for (int i = 0; i < table.length; i++) { if ((min(table[i]) < mi) && (min(table[i]) > 0)) { // mi = min(table[i]); // } if (max(table[i]) > ma) { // ma = max(table[i]); // } } println(mi + " " + ma); // My values are 14 and 47. In principle, this is not important, because we can use the values of variables. Now we need every time we access a table cell, i.e. Before drawing each rectangle, set your fill:
void setup() { size(512, 671); // background(255); // - String[] file = loadStrings("data/bdates.txt"); // int[][] table = new int[12][31]; for (int i = 0; i < file.length; i++) { // String[] date = file[i].split("\\."); // , if ((int(date[1]) <= 12) && (int(date[1]) > 0) && (int(date[0]) <= 31) && (int(date[0]) > 0)) { // table[int(date[1])-1][int(date[0])-1]++; // 1 } } table[1][29] = 0; //30 table[1][30] = 0; //31 table[3][30] = 0; //31 table[5][30] = 0; //31 table[8][30] = 0; //31 table[10][30] = 0; //31 int mi = table[0][0]; // int ma = table[0][0]; // for (int i = 0; i < table.length; i++) { if ((min(table[i]) < mi) && (min(table[i]) > 0)) { // mi = min(table[i]); // } if (max(table[i]) > ma) { // ma = max(table[i]); // } } color c = color(54, 99, 142); noStroke(); for (int i = 0; i < table.length; i++) { // for (int j = 0; j < table[i].length; j++) { // fill(c, map(table[i][j], 0, ma, 0, 255)); // rect(10+41*i, 10+21*j, 40, 20); // } } } ? , . , 29 . , , , , ( 14, 0 — , 0 85. . map() , 12, 29 . - , 12, , , 0, . (-5 — 250!), , , . , «» :
void setup() { size(512, 671); // background(255); // - String[] file = loadStrings("data/bdates.txt"); // int[][] table = new int[12][31]; for (int i = 0; i < file.length; i++) { // String[] date = file[i].split("\\."); // , if ((int(date[1]) <= 12) && (int(date[1]) > 0) && (int(date[0]) <= 31) && (int(date[0]) > 0)) { // table[int(date[1])-1][int(date[0])-1]++; // 1 } } table[1][29] = 0; //30 table[1][30] = 0; //31 table[3][30] = 0; //31 table[5][30] = 0; //31 table[8][30] = 0; //31 table[10][30] = 0; //31 int mi = table[0][0]; // int ma = table[0][0]; // for (int i = 0; i < table.length; i++) { if ((min(table[i]) < mi) && (min(table[i]) > 0)) { // mi = min(table[i]); // } if (max(table[i]) > ma) { // ma = max(table[i]); // } } color c = color(54, 99, 142); noStroke(); for (int i = 0; i < table.length; i++) { // for (int j = 0; j < table[i].length; j++) { // if (table[i][j] > 0) { fill(c, map(table[i][j], 12, ma, 0, 255)); // rect(10+41*i, 10+21*j, 40, 20); // } } } } 
? - 1 . . 300 000 , 1 , . , , , , . . , , table[0][0] . , saveFrame(«frame.jpg»); . .
:
void setup() { size(512, 671); // background(255); // - String[] file = loadStrings("data/bdates.txt"); // int[][] table = new int[12][31]; for (int i = 0; i < file.length; i++) { // String[] date = file[i].split("\\."); // , if ((int(date[1]) <= 12) && (int(date[1]) > 0) && (int(date[0]) <= 31) && (int(date[0]) > 0)) { // table[int(date[1])-1][int(date[0])-1]++; // 1 } } table[0][0] = 0; //1 table[1][29] = 0; //30 table[1][30] = 0; //31 table[3][30] = 0; //31 table[5][30] = 0; //31 table[8][30] = 0; //31 table[10][30] = 0; //31 int mi = table[0][0]; // int ma = table[0][0]; // for (int i = 0; i < table.length; i++) { if ((min(table[i]) < mi) && (min(table[i]) > 0)) { // mi = min(table[i]); // } if (max(table[i]) > ma) { // ma = max(table[i]); // } } color c = color(54, 99, 142); noStroke(); for (int i = 0; i < table.length; i++) { // for (int j = 0; j < table[i].length; j++) { // if (table[i][j] > 0) { fill(c, map(table[i][j], 12, ma, 0, 255)); // rect(10+41*i, 10+21*j, 40, 20); // } } } saveFrame("frame.jpg"); // } 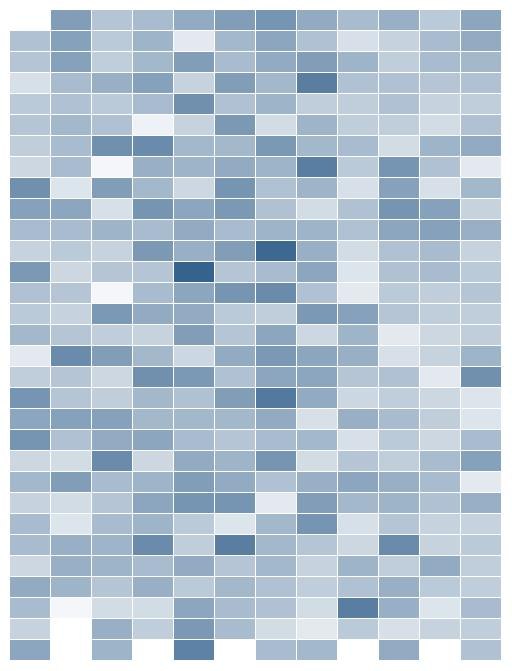
Done! , , , . 300 000 (, 100 , — , - Processing), ( ):
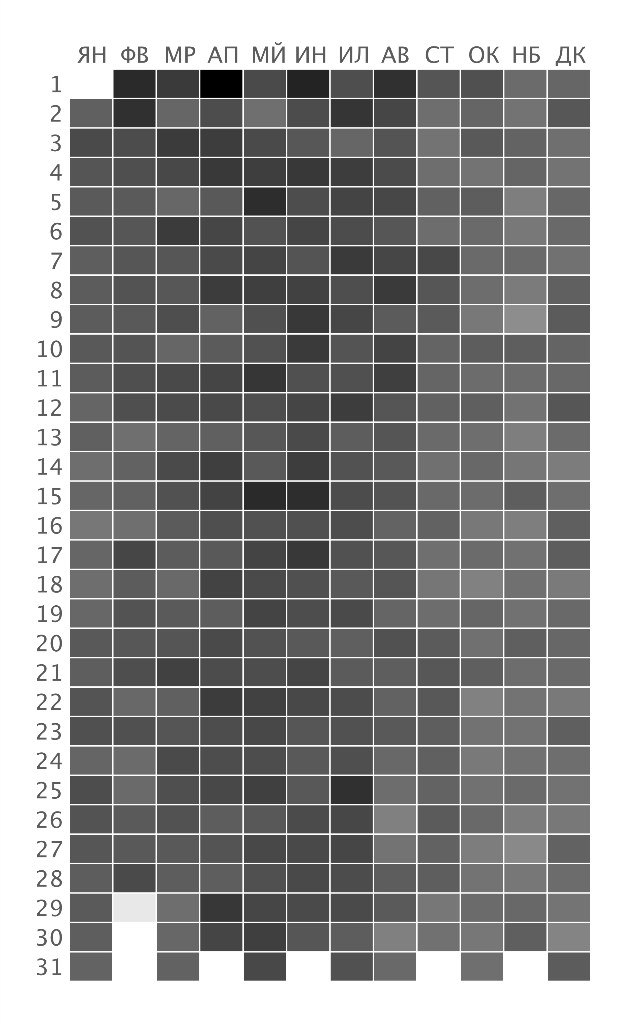
! ;]
Source: https://habr.com/ru/post/144531/
All Articles