Who's there? - Identification of the person by voice

Hello, dear reader!
I bring to your attention an interesting and informative article about a particular method of recognizing the speaker. Just a couple of months ago, I came across an article on the use of chalk-cepstral coefficients for speech recognition. She did not find a response, probably because of insufficient structuring, although the material in it is very interesting. I will take the responsibility to bring this material in an accessible form and continue the topic of speech recognition in Habré.
')
Under the cut, I will describe the whole process of identifying a person by voice, from recording and processing the sound to directly determining the identity of the speaker.
Sound recording
Our story begins with the recording of an analog signal from an external source using a microphone. As a result of this operation, we obtain a set of values that correspond to a change in the amplitude of a sound with time. This coding principle is called pulse code modulation aka PCM (Pulse-code modulation). As you might guess, the “raw” data obtained from the audio stream is not yet suitable for our purposes. The first step is to convert the naughty bits into a set of meaningful values - signal amplitudes. [1, p. 31] As input, I will use an uncompressed 16-bit signed (PCM-signed) wav file with a sampling frequency of 16 kHz.
double[] readAmplitudeValues(bool isBigEndian) { int MSB, LSB; // byte[] buffer = ReadDataFromExternalSource(); // - double[] data = new double[buffer.length / 2]; for (int i = 0; i < buffer.length; i += 2) { if(isBigEndian) // { // MSB MSB = buffer[2 * i]; // LSB LSB = buffer[2 * i + 1]; } else { // LSB = buffer[2 * i]; MSB = buffer[2 * i + 1]; } // , 16- // - 2^15 data[i] = ((MSB << 8) || LSB) / 32768; } return data; } Refresh the knowledge about the order of bytes can be on Wikipedia .
Sound processing
The obtained amplitude values may not coincide even for two identical records due to external noise, different input loudness and other factors. Normalization is used to bring the sounds to a “common denominator”. The idea of peak normalization is simple: divide all amplitude values by the maximum (within a given sound file). Thus, we equated speech patterns recorded at different loudness, putting everything in the scale from -1 to 1. It is important that after such a transformation, any sound completely fills a given interval.
Normalization, in my opinion, is the simplest and most effective algorithm for sound preprocessing. There are also a lot of others: “cutting off” frequencies above or below a given one, smoothing, etc.
Divide and rule
Even when working with sound with a minimum sufficient sampling rate (16 kHz), the size of the unique characteristics for the second sound sample is simply huge - 16000 amplitude values. It is not possible to perform any complicated operations on such data volumes. In addition, it is not entirely clear how to compare objects with different numbers of unique features.
To begin with, we will reduce the computational complexity of the problem, breaking it up into smaller subtasks. With this move we kill two birds with one stone, because by setting a fixed size of the subtasks and averaging the results of calculations for all the tasks, we will get a predetermined number of signs for classification.
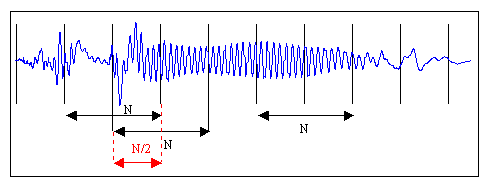
The figure shows the "cutting" of the sound signal into frames of length N with half overlap. The need for overlap caused by the distortion of the sound if the frames were located nearby. Although in practice this technique is often neglected to save computational resources. Following the recommendations [1, p. 28], choose a frame length of 128 ms, as a compromise between accuracy (long frames) and speed (short frames). The rest of the speech, which does not occupy a full frame, can be filled with zeros to the desired size, or simply discarded.
To eliminate undesirable effects in the further processing of frames, multiply each element of the frame by a special weight function (“window”). The result will be the selection of the central part of the frame and the smooth attenuation of the amplitudes at its edges. This is necessary to achieve the best results in the Fourier transform , since it is oriented towards an infinitely repetitive signal. Accordingly, our frame should dock with itself and as smoothly as possible. There are a great many windows. We will use the Hamming window.
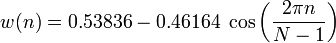
n is the sequence number of the element in the frame for which the new amplitude value is calculated
N - as before, the frame length (the number of signal values measured during the period)
Discrete Fourier Transform
The next step is to obtain a short-term spectrogram of each frame separately. For these purposes we use the discrete Fourier transform .

N - as before, the frame length (the number of signal values measured during the period)
x n - the amplitude of the n-th signal
X k - N complex amplitudes of sinusoidal signals composing the original signal
In addition, we will square each value of X k for further logarithmization.
Go to chalk scale
To date, the most successful are voice recognition systems that use knowledge about the structure of the hearing aid. A few words about this are on Habré . In short, the ear interprets sounds not linearly, but on a logarithmic scale. Until now, we have performed all the operations on the “Hertz”, now we will move on to the “Melam”. To visualize the dependence will help drawing.

As can be seen, the chalk scale behaves linearly up to 1000 Hz, and then it shows a logarithmic nature. The transition to a new scale is described by a simple dependency.

m is the frequency in chalk
f - frequency in hertz
Getting feature vector
Now we are closer than ever to our goal. The feature vector will consist of those very small cepstral coefficients. We calculate them by the formula [2]
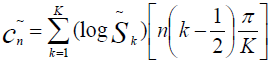
c n - chalk-cepstral coefficient n
S k - the amplitude of the k-th value in the frame in chalk
K - advance the specified number of chalk-core coefficients
n ∈ [1, K]
As a rule, the number K is chosen equal to 20 and start counting from 1 due to the fact that the coefficient c 0 carries little information about the speaker, since it is, in fact, averaging the amplitudes of the input signal. [2]
So who did say all the same?
The last stage is the classification of the speaker. The classification is made by calculating the measure of similarity of the test data and those already known. The measure of similarity is expressed by the distance from the vector of signs of the test signal to the vector of signs already classified. We will be interested in the simplest solution - the distance of city blocks .

This solution is more suitable for vectors of discrete nature, in contrast to the Euclidean distance.
An attentive reader certainly remembers that the author at the beginning of the article mentioned the averaging of features of speech frames. So, filling this gap, I conclude the article with a description of the algorithm for finding the average feature vector for several frames and several speech patterns.
Clustering
Finding a feature vector for one sample is not difficult: such a vector is represented as an arithmetic average of the vectors characterizing individual frames of speech. To improve the recognition accuracy, it is simply necessary to average the results not only between frames, but also to take into account the performance of several speech samples. Having several voice recordings, it is reasonable not to average the indicators to one vector, but to clusterize, for example, using the k- means method.
Results
Thus, I talked about a simple but effective system for identifying a person by voice. Summarizing, the recognition process is constructed as follows:
- We collect several speech training samples, the more - the better.
- We find for each of them a characteristic feature vector.
- For samples with a known author, we perform clustering with one center (averaging) or several. Acceptable results begin with the use of 4 centers for each speaker. [2]
- In the identification mode, we find the distance from the test vector to the cluster centers studied during the training. Which cluster test speech will be closer - to such a speaker and refer the sample.
- It is possible to experimentally establish even a certain confidence interval — the maximum distance at which the test sample may be located from the center of the cluster. If this value is exceeded, classify the sample as unknown.
I always welcome helpful comments about improving the material. Thanks for attention.
Literature:
Source: https://habr.com/ru/post/144491/
All Articles