Debugging of complex web applications - an effective buggy on the production-servers
Hello!
Today I’ll tell you how on combat servers during a load, in dust and dirt, it is effective to catch bottlenecks in the performance of large web applications in PHP, as well as to look for and fix "non-standard" errors. We successfully use many of the described techniques on our cloud service Bitrix24 .
Information, I hope, will be useful for system administrators and developers serving complex web projects, as well as managers who want to build an effective and fast process of finding and eliminating the bottlenecks and errors of PHP projects.

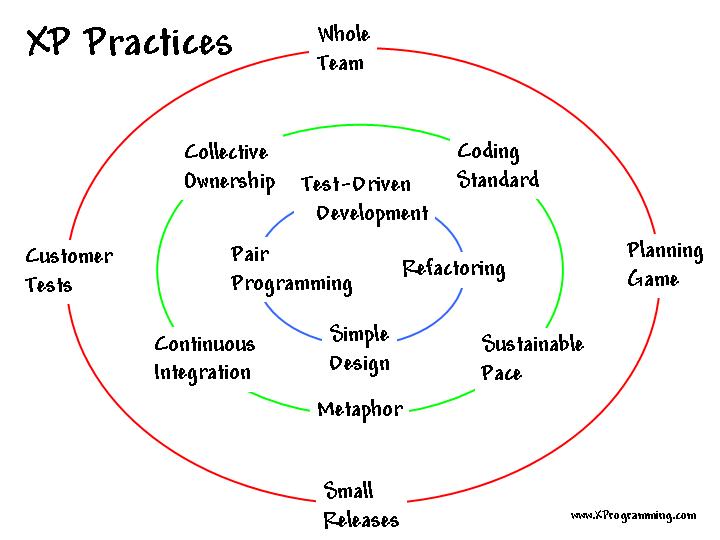
There is such a kind and bright myth from XP / TDD that you can cover the web application with 100% modular and functional tests, write a bunch of Selenium tests that click on the system outside and without any fear to bring improvements to the system and upload it to the battle through the process of continuous integration :-) This romance from the category of “to love to the grave and change before dying”, fortunately, is far from reality and that is why:
In general, if you still believe that tests will protect you 100% of the problems and should be 2 times more than the code, then you can not read - programming is not for romantics :-)

Nevertheless, and everyone understands this, you need to write tests. For key things, for system modules - you need to write and keep up to date. For other tasks, you can write test plans and test with the “human factor” by clicking the testers department on all the web solution pages before each update, carefully observing errors in the logs and collecting feedback from users.
Thus, if your project is still alive and successfully working on the network, you most likely use both unit tests, functional tests, and Selenium , and a variant of the process of continuous integration with the version control system and the labor of testers. At the same time, you understand that errors will necessarily be leaked to the combat servers and you need to learn how to quickly find and fix them. The main idea here is to lay straws in a reasonable amount and keep efficient weapons at the ready, capable of cutting off any head or performance problem with lightning speed.
')
Many projects cost the var_dump and echo team :-), however, as they become more complex, developers will likely install something like XDebug or Zend Debugger on local servers — which makes it reasonable and really easy to debug a web application if you learn use these things wisely.
XDebug is very often useful in the collection mode of a trace . Sometimes, without a trace, it is simply impossible to catch an error or a bottleneck in performance.
Nevertheless, there is one weighty but - these tools create a serious load on the web project and include them on the combat servers - it is dangerous. The tools will help you to “lick” the code on the local servers, but “survive in battle”, unfortunately, will not help.
It is very useful if the load allows, to include on the combat servers the log files of nginx, apache, php-fpm, to keep your log files of business operations (creating special orders, export from 1C-Bitrix to SAP, etc.).
If you have a web cluster or just a lot of servers with PHP - try to collect logs from these machines on one machine, where they are centrally monitored. On Bitrix24 , we use syslog-ng for this. Having a PHP error log from all servers of the cluster on one machine, in one file, you don’t have to run around with machines with your eyes wide open in case of an accident. Run the screen and you know what is happening.
Fortunately, PHP developers and administrators, colleagues from Facebook wrote and posted for common use an excellent and useful "combat" profiler - xhprof . If you are not familiar with this tool - study it. It is adjusted in 2 clicks, and benefits by 5 tons.

The most important thing is that you can turn it on in combat, because it practically does not create a load on PHP (percentages).
It allows you to see the hit performance profile:

And also a critical path - what was the same thing that slowed down the battle:

And it fits well with the built-in debugging tool of the Bitrix platform (if you have a web solution on this platform) - xhprof can be launched at combat at peak loads, and a performance monitor when the load does not go off scale or on development / testing servers.
If you have a web cluster , it is often convenient to automate the process of dynamic profiling. The essence is simple - the profiler is always on, after the page is executed, we check the hit time and if it is longer, for example, 2 seconds, we save the trace to a file. Yes, it adds an extra 50-100 ms, so you can turn on the system if necessary or turn on each, for example, the tenth hit.
Thus, if the hit was longer than 2 seconds, we save it in a temporary folder on the server. Then, on the monitoring machine, you can bypass the server and pick up traces for centralized analysis from them (example for virtual hosts in Amazon):
Now you have query traces collected in one place for more than 2 seconds - it will take about 30 minutes to write a web interface to view them in a sorted order by date. Part of the business process is ready - every trace is actually a TOR for web application optimization him specialists from the development.
Sometimes the profiler and log files do not allow you to determine the cause of the problem. However, when debugging (XDebug) on development servers, the problem cannot be reproduced. One thing remains, to understand what is happening at the time of the occurrence of events on the combat server. There is often an invaluable help to the system call tracer, such as strace . Just do not need to fall into a stupor at the sight of Linux system calls - believe me, a little patience, 2-3 coffee mugs and you will understand the idea and be able to catch the most subtle errors and bottlenecks on the combat servers :-)
You need to properly "hook" the tracer to PHP processes. There are often a lot of processes running, in different pools, they are constantly quenched and raised (often, to protect against memory leaks, the process lasts for example 100 hits):
In order not to chase the changing idshnikami PHP processes, you can put them temporarily short time of life:
and run strace like this:
strace -p 24166 -f -s 128 -tt -o trace.log
Those. we hang it on the rutovy process and when new descendants appear, it will automatically start treating them too. Simply.
Now it is desirable to start writing PHP process logs in the PHP log files so that you can quickly match a long hit from the log with a specific process process:
It now remains to wait for the victim to appear, for example, a long hit:

The first is that the system calls are low-level “elementary” operations that the program communicates with the operating system — they build all of the IT universe with different programming languages and technologies and there are not very many of them (like a small number of processor commands and an infinite number of languages and dialects above stack). The second thing you need to understand is that the PHP commands of the web project are executed strictly one after the other in the framework of ONE PROCESS. Therefore, in the trace you need to filter the process of a suspicious hit - 22722:
cat trace.log | grep '22722' | less
The time of the hit is known from the log, it remains to see what happened during the construction of the page and why it hung so long (the trace was edited a little).
Visible queries to the database and answers:
File accesses:
Interaction with memcached:
And here we see, for example, why the hit is frozen:
At first, there were calls to memcached: write / read socket 10, then the socket was successfully closed (“close” = 0), then the code contained a call to usleep in a loop and the exit condition did not work because of the previously closed socket. As a result, the cause was able to determine - quickly and correct the code.
Do not hesitate to unix system calls, they are simple and straightforward. Many objects in the system are represented as files and sockets. For any call, you can quickly get embedded information:
man 2 open
man 2 sendto
man 2 nanosleep
If you do not have these manuals, you can put them like this (on CentOS6):
yum install man-pages
You can also view the latest system call documentation on the web or from the console: “man syscalls”.
After spending a little time understanding how PHP works at the operating system level, you will get a secret weapon in your hands that allows you to quickly find and remove almost any bottleneck of a high-load web project!
Good luck to everyone, stable web projects, reliable hosting and a relaxing, serene vacation! And, of course, I invite everyone to our new cloud project deployed in the Amazon - “Bitrix24” !
Today I’ll tell you how on combat servers during a load, in dust and dirt, it is effective to catch bottlenecks in the performance of large web applications in PHP, as well as to look for and fix "non-standard" errors. We successfully use many of the described techniques on our cloud service Bitrix24 .
Information, I hope, will be useful for system administrators and developers serving complex web projects, as well as managers who want to build an effective and fast process of finding and eliminating the bottlenecks and errors of PHP projects.
Full Testing Myth
There is such a kind and bright myth from XP / TDD that you can cover the web application with 100% modular and functional tests, write a bunch of Selenium tests that click on the system outside and without any fear to bring improvements to the system and upload it to the battle through the process of continuous integration :-) This romance from the category of “to love to the grave and change before dying”, fortunately, is far from reality and that is why:
- Requirements for the web project will constantly change, CONSTANTLY, until the very launch. In theory, they can be fixed, of course, but before launching, the manager must be drawn with a Nazi smile and the words “urgent, today.”
- If you cover everything with tests according to your conscience, there will not be enough programmers and time, believe me. Often there are deviations of the type of writing mock-objects to the Amazon API , you can still test the operating system system calls :-)
- If the layout often changes on a web project it will be difficult, it is very difficult to keep Selenium- tests up to date
- Some things, such as site stability under load, are not easy to test. It is necessary to break your head and come up with a load scheme that looks like a real one, but it will be different anyway.
- We intuitively trust ... a programming language, and it may contain bugs that will appear completely suddenly. So why don't we cover it with PHP tests?
- etc.
In general, if you still believe that tests will protect you 100% of the problems and should be 2 times more than the code, then you can not read - programming is not for romantics :-)
Nevertheless, and everyone understands this, you need to write tests. For key things, for system modules - you need to write and keep up to date. For other tasks, you can write test plans and test with the “human factor” by clicking the testers department on all the web solution pages before each update, carefully observing errors in the logs and collecting feedback from users.
Thus, if your project is still alive and successfully working on the network, you most likely use both unit tests, functional tests, and Selenium , and a variant of the process of continuous integration with the version control system and the labor of testers. At the same time, you understand that errors will necessarily be leaked to the combat servers and you need to learn how to quickly find and fix them. The main idea here is to lay straws in a reasonable amount and keep efficient weapons at the ready, capable of cutting off any head or performance problem with lightning speed.
')
PHP Debugging Tools
Many projects cost the var_dump and echo team :-), however, as they become more complex, developers will likely install something like XDebug or Zend Debugger on local servers — which makes it reasonable and really easy to debug a web application if you learn use these things wisely.
XDebug is very often useful in the collection mode of a trace . Sometimes, without a trace, it is simply impossible to catch an error or a bottleneck in performance.
Nevertheless, there is one weighty but - these tools create a serious load on the web project and include them on the combat servers - it is dangerous. The tools will help you to “lick” the code on the local servers, but “survive in battle”, unfortunately, will not help.
Debugging in combat
Log everything
It is very useful if the load allows, to include on the combat servers the log files of nginx, apache, php-fpm, to keep your log files of business operations (creating special orders, export from 1C-Bitrix to SAP, etc.).
If you have a web cluster or just a lot of servers with PHP - try to collect logs from these machines on one machine, where they are centrally monitored. On Bitrix24 , we use syslog-ng for this. Having a PHP error log from all servers of the cluster on one machine, in one file, you don’t have to run around with machines with your eyes wide open in case of an accident. Run the screen and you know what is happening.
"Fighting" profiler - xhprof
Fortunately, PHP developers and administrators, colleagues from Facebook wrote and posted for common use an excellent and useful "combat" profiler - xhprof . If you are not familiar with this tool - study it. It is adjusted in 2 clicks, and benefits by 5 tons.
The most important thing is that you can turn it on in combat, because it practically does not create a load on PHP (percentages).
It allows you to see the hit performance profile:
And also a critical path - what was the same thing that slowed down the battle:
And it fits well with the built-in debugging tool of the Bitrix platform (if you have a web solution on this platform) - xhprof can be launched at combat at peak loads, and a performance monitor when the load does not go off scale or on development / testing servers.
Dynamic tracing
If you have a web cluster , it is often convenient to automate the process of dynamic profiling. The essence is simple - the profiler is always on, after the page is executed, we check the hit time and if it is longer, for example, 2 seconds, we save the trace to a file. Yes, it adds an extra 50-100 ms, so you can turn on the system if necessary or turn on each, for example, the tenth hit.
auto_prepend_file.php: // , if (isset($_GET['profile']) && $_GET['profile']=='Y') { setcookie("my_profile", "Y"); } if (isset($_GET['profile']) && $_GET['profile']=='N') { setcookie("my_profile", "",time() - 3600); } if ( !( isset($_GET['profile']) && $_GET['profile']=='N') && ( $_COOKIE['my_profile']=='Y' || ( isset($_GET['profile']) && $_GET['profile']=='Y') ) && extension_loaded('xhprof') ) { xhprof_enable(); } dbconn.php: // , PHP (http://php.net/manual/ru/function.microtime.php) //Forcing storing trace, if req.time > N secs $profile_force_store = false; $ar_pinba = pinba_get_info(); if ($ar_pinba['req_time']>2) $profile_force_store=true; ... if ($profile_force_store || ( !(isset($_GET['profile']) && $_GET['profile']=='N') && ( $_COOKIE['my_profile']=='Y' || ( isset($_GET['profile']) && $_GET['profile']=='Y' )) && extension_loaded('xhprof') ) { $xhprof_data = xhprof_disable(); $XHPROF_ROOT = realpath(dirname(__FILE__)."/perf_stat"); include_once $XHPROF_ROOT . "/xhprof_lib/utils/xhprof_lib.php"; include_once $XHPROF_ROOT . "/xhprof_lib/utils/xhprof_runs.php"; // save raw data for this profiler run using default // implementation of iXHProfRuns. $xhprof_runs = new XHProfRuns_Default(); // save the run under a namespace "xhprof_foo" $run_id = $xhprof_runs->save_run($xhprof_data, "xhprof_${_SERVER["HTTP_HOST"]}_".str_replace('/','_',$_SERVER["REQUEST_URI"])); Thus, if the hit was longer than 2 seconds, we save it in a temporary folder on the server. Then, on the monitoring machine, you can bypass the server and pick up traces for centralized analysis from them (example for virtual hosts in Amazon):
#!/bin/bash HOSTS=`as-describe-auto-scaling-groups mygroup | grep -i 'INSTANCE' | awk '{ print $2}' | xargs ec2-describe-instances | grep 'INSTANCE' | awk '{print $4}'` for HOST in $HOSTS ; do scp -o UserKnownHostsFile=/dev/null -o StrictHostKeyChecking=no -p -i /home/trace_loader/.ssh/id_rsa "trace_loader@${HOST}:/tmp/*xhprof*" /my_profiles done Now you have query traces collected in one place for more than 2 seconds - it will take about 30 minutes to write a web interface to view them in a sorted order by date. Part of the business process is ready - every trace is actually a TOR for web application optimization him specialists from the development.
Dive deeper - strace
Sometimes the profiler and log files do not allow you to determine the cause of the problem. However, when debugging (XDebug) on development servers, the problem cannot be reproduced. One thing remains, to understand what is happening at the time of the occurrence of events on the combat server. There is often an invaluable help to the system call tracer, such as strace . Just do not need to fall into a stupor at the sight of Linux system calls - believe me, a little patience, 2-3 coffee mugs and you will understand the idea and be able to catch the most subtle errors and bottlenecks on the combat servers :-)
You need to properly "hook" the tracer to PHP processes. There are often a lot of processes running, in different pools, they are constantly quenched and raised (often, to protect against memory leaks, the process lasts for example 100 hits):
ps aux | grep php
root 24166 0.0 0.0 391512 4128 ? Ss 11:47 0:00 php-fpm: master process (/etc/php-fpm.conf)
nobody 24167 0.0 0.6 409076 48168 ? S 11:47 0:00 php-fpm: pool www1
nobody 24168 0.0 0.4 401736 30780 ? S 11:47 0:00 php-fpm: pool www1
nobody 24169 0.0 0.5 403276 39816 ? S 11:47 0:00 php-fpm: pool www1
nobody 24170 0.0 1.0 420504 83376 ? S 11:47 0:01 php-fpm: pool www1
nobody 24171 0.0 0.6 408396 49884 ? S 11:47 0:00 php-fpm: pool www1
nobody 24172 0.0 0.5 404476 40348 ? S 11:47 0:00 php-fpm: pool www2
nobody 24173 0.0 0.4 404124 35992 ? S 11:47 0:00 php-fpm: pool www2
nobody 24174 0.0 0.5 404852 42400 ? S 11:47 0:00 php-fpm: pool www2
nobody 24175 0.0 0.4 402400 35576 ? S 11:47 0:00 php-fpm: pool www2
nobody 24176 0.0 0.4 403576 35804 ? S 11:47 0:00 php-fpm: pool www2
nobody 24177 0.0 0.7 410676 55488 ? S 11:47 0:00 php-fpm: pool www3
nobody 24178 0.0 0.6 409912 53432 ? S 11:47 0:00 php-fpm: pool www3
nobody 24179 0.1 1.3 435216 106892 ? S 11:47 0:02 php-fpm: pool www3
nobody 24180 0.0 0.7 413492 59956 ? S 11:47 0:00 php-fpm: pool www3
nobody 24181 0.0 0.4 402760 35852 ? S 11:47 0:00 php-fpm: pool www3
nobody 24182 0.0 0.4 401464 37040 ? S 11:47 0:00 php-fpm: pool www4
nobody 24183 0.0 0.5 404476 40268 ? S 11:47 0:00 php-fpm: pool www4
nobody 24184 0.0 0.9 409564 72888 ? S 11:47 0:01 php-fpm: pool www4
nobody 24185 0.0 0.5 404048 40504 ? S 11:47 0:00 php-fpm: pool www4
nobody 24186 0.0 0.5 403004 40296 ? S 11:47 0:00 php-fpm: pool www4
In order not to chase the changing idshnikami PHP processes, you can put them temporarily short time of life:
pm.max_children = 5
pm.start_servers = 5
pm.min_spare_servers = 5
pm.max_spare_servers = 5

pm.max_requests = 100
and run strace like this:
strace -p 24166 -f -s 128 -tt -o trace.log
Those. we hang it on the rutovy process and when new descendants appear, it will automatically start treating them too. Simply.
Now it is desirable to start writing PHP process logs in the PHP log files so that you can quickly match a long hit from the log with a specific process process:
access.log = /opt/php/var/log/www.access.log
access.format = "%R # %{HTTP_HOST}e # %{HTTP_USER_AGENT}e # %t # %m # %r # %Q%q # %s # %f # %{mili}d # %{kilo}M # %{user}C+%{system}C # %p "
It now remains to wait for the victim to appear, for example, a long hit:
[24-May-2012 11:43:49] WARNING: [pool www1] child 22722, script '/var/www/html/myfile.php' (request: "POST /var/www/html/myfile.php") executing too slow (38.064443 sec), logging

- # mysite.ru # Mozilla/5.0 (Windows NT 6.1; WOW64; rv:12.0) Gecko/20100101 Firefox/12.0 # 24/May/2012:11:43:11 +0400 # POST # /var/www/html/myfile.php # # 200 # /var/www/html/myfile.php # 61131.784 # 6656 # 0.03+0.03 # 22722
We treat system calls
The first is that the system calls are low-level “elementary” operations that the program communicates with the operating system — they build all of the IT universe with different programming languages and technologies and there are not very many of them (like a small number of processor commands and an infinite number of languages and dialects above stack). The second thing you need to understand is that the PHP commands of the web project are executed strictly one after the other in the framework of ONE PROCESS. Therefore, in the trace you need to filter the process of a suspicious hit - 22722:
cat trace.log | grep '22722' | less
The time of the hit is known from the log, it remains to see what happened during the construction of the page and why it hung so long (the trace was edited a little).
Visible queries to the database and answers:
24167 12:47:50.252654 write(6, "u\0\0\0\3select name, name, password ...", 121) = 121
24167 12:47:50.252915 read(6, "pupkin, 123456"..., 16384) = 458
File accesses:
24167 12:47:50.255299 open("/var/www/html/myfile.php", O_RDONLY) = 7
Interaction with memcached:
24167 12:47:50.262654 sendto(9, "add mykey 0 55 1\r\n1\r\n", 65, MSG_DONTWAIT, NULL, 0) = 65
24167 12:47:50.263151 recvfrom(9, "STORED\r\n", 8192, MSG_DONTWAIT, NULL, NULL) = 8
...
24167 12:47:50.282681 sendto(9, "delete mykey 0\r\n", 60, MSG_DONTWAIT, NULL, 0) = 60
24167 12:47:50.283998 recvfrom(9, "DELETED\r\n", 8192, MSG_DONTWAIT, NULL, NULL) = 9
And here we see, for example, why the hit is frozen:
22722 11:43:11.487757 sendto(10, "delete mykey 0\r\n", 55, MSG_DONTWAIT, NULL, 0) = 55
22722 11:43:11.487899 poll([{fd=10, events=POLLIN|POLLERR|POLLHUP}], 1, 1000) = 1 ([{fd=10, revents=POLLIN}])
22722 11:43:11.488420 recvfrom(10, "DELETED\r\n", 8192, MSG_DONTWAIT, NULL, NULL) = 9
22722 11:43:11.488569 sendto(10, "delete mykey2 0\r\n", 60, MSG_DONTWAIT, NULL, 0) = 60
22722 11:43:11.488714 poll([{fd=10, events=POLLIN|POLLERR|POLLHUP}], 1, 1000) = 1 ([{fd=10, revents=POLLIN}])
22722 11:43:11.489215 recvfrom(10, "DELETED\r\n", 8192, MSG_DONTWAIT, NULL, NULL) = 9
22722 11:43:11.489351 close(10) = 0
22722 11:43:11.489552 gettimeofday({1337845391, 489591}, NULL) = 0
22722 11:43:11.489695 gettimeofday({1337845391, 489727}, NULL) = 0
22722 11:43:11.489855 nanosleep({0, 100000}, NULL) = 0
22722 11:43:11.490155 nanosleep({0, 200000}, NULL) = 0
22722 11:43:11.490540 nanosleep({0, 400000}, NULL) = 0
22722 11:43:11.491121 nanosleep({0, 800000}, NULL) = 0
22722 11:43:11.492103 nanosleep({0, 1600000}, NULL) = 0
22722 11:43:11.493887 nanosleep({0, 3200000}, NULL) = 0
22722 11:43:11.497269 nanosleep({0, 6400000}, NULL) = 0
22722 11:43:11.503852 nanosleep({0, 12800000}, NULL) = 0
22722 11:43:11.516836 nanosleep({0, 25600000}, NULL) = 0
22722 11:43:11.542620 nanosleep({0, 51200000}, NULL) = 0
22722 11:43:11.594019 nanosleep({0, 102400000}, NULL) = 0
22722 11:43:11.696619 nanosleep({0, 204800000}, NULL) = 0
22722 11:43:11.901622 nanosleep({0, 409600000}, NULL) = 0
22722 11:43:12.311430 nanosleep({0, 819200000}, <unfinished ...>
22722 11:43:13.130867 <... nanosleep resumed> NULL) = 0
22722 11:43:13.131025 nanosleep({1, 638400000}, <unfinished ...>
22722 11:43:14.769688 <... nanosleep resumed> NULL) = 0
22722 11:43:14.770104 nanosleep({1, 638400000}, <unfinished ...>
22722 11:43:16.408860 <... nanosleep resumed> NULL) = 0
22722 11:43:16.409048 nanosleep({1, 638400000}, <unfinished ...>
22722 11:43:18.047808 <... nanosleep resumed> NULL) = 0
22722 11:43:18.048103 nanosleep({1, 638400000}, <unfinished ...>
22722 11:43:19.686947 <... nanosleep resumed> NULL) = 0
22722 11:43:19.687085 nanosleep({1, 638400000}, <unfinished ...>
22724 11:43:20.227224 <... lstat resumed> 0x7fff00adb080) = -1 ENOENT (No such file or directory)
22722 11:43:21.325824 <... nanosleep resumed> NULL) = 0
22722 11:43:21.326219 nanosleep({1, 638400000}, <unfinished ...>
22722 11:43:22.964830 <... nanosleep resumed> NULL) = 0
22722 11:43:22.965126 nanosleep({1, 638400000}, <unfinished ...>
22722 11:43:24.603692 <... nanosleep resumed> NULL) = 0
22722 11:43:24.604117 nanosleep({1, 638400000}, <unfinished ...>
22722 11:43:26.250371 <... nanosleep resumed> NULL) = 0
22722 11:43:26.250580 nanosleep({1, 638400000}, <unfinished ...>
22722 11:43:27.889372 <... nanosleep resumed> NULL) = 0
22722 11:43:27.889614 nanosleep({1, 638400000}, <unfinished ...>
22722 11:43:29.534127 <... nanosleep resumed> NULL) = 0
22722 11:43:29.534313 nanosleep({1, 638400000}, <unfinished ...>
22722 11:43:31.173004 <... nanosleep resumed> NULL) = 0
22722 11:43:31.173273 nanosleep({1, 638400000}, <unfinished ...>
22722 11:43:32.812113 <... nanosleep resumed> NULL) = 0
22722 11:43:32.812531 nanosleep({1, 638400000}, <unfinished ...>
22722 11:43:34.451236 <... nanosleep resumed> NULL) = 0
22722 11:43:34.451554 nanosleep({1, 638400000}, <unfinished ...>
22722 11:43:36.090229 <... nanosleep resumed> NULL) = 0
22722 11:43:36.090317 nanosleep({1, 638400000}, <unfinished ...>
22724 11:43:36.522722 fstat(12, <unfinished ...>
22723 11:43:36.622833 <... gettimeofday resumed> {1337845416, 622722}, NULL) = 0
22722 11:43:37.729696 <... nanosleep resumed> NULL) = 0
22722 11:43:37.730033 nanosleep({1, 638400000}, <unfinished ...>
22724 11:43:39.322722 gettimeofday( <unfinished ...>
22722 11:43:39.368671 <... nanosleep resumed> NULL) = 0
22722 11:43:39.368930 nanosleep({1, 638400000}, <unfinished ...>
22722 11:43:41.007574 <... nanosleep resumed> NULL) = 0
22722 11:43:41.007998 nanosleep({1, 638400000}, <unfinished ...>
22722 11:43:42.646895 <... nanosleep resumed> NULL) = 0
22722 11:43:42.647140 nanosleep({1, 638400000}, <unfinished ...>
22720 11:43:43.022722 fstat(12, <unfinished ...>
22720 11:43:43.622722 munmap(0x7fa1e736a000, 646) = 0
22722 11:43:44.285702 <... nanosleep resumed> NULL) = 0
22722 11:43:44.285973 nanosleep({1, 638400000}, <unfinished ...>
22722 11:43:45.926593 <... nanosleep resumed> NULL) = 0
22722 11:43:45.926793 nanosleep({1, 638400000}, <unfinished ...>
22722 11:43:47.566124 <... nanosleep resumed> NULL) = 0
22722 11:43:47.566344 nanosleep({1, 638400000}, <unfinished ...>
22722 11:43:49.205103 <... nanosleep resumed> NULL) = 0
22722 11:43:49.205311 nanosleep({1, 638400000}, <unfinished ...>
22719 11:43:49.440580 ptrace(PTRACE_ATTACH, 22722, 0, 0 <unfinished ...>
At first, there were calls to memcached: write / read socket 10, then the socket was successfully closed (“close” = 0), then the code contained a call to usleep in a loop and the exit condition did not work because of the previously closed socket. As a result, the cause was able to determine - quickly and correct the code.
Do not hesitate to unix system calls, they are simple and straightforward. Many objects in the system are represented as files and sockets. For any call, you can quickly get embedded information:
man 2 open
man 2 sendto
man 2 nanosleep
If you do not have these manuals, you can put them like this (on CentOS6):
yum install man-pages
You can also view the latest system call documentation on the web or from the console: “man syscalls”.
After spending a little time understanding how PHP works at the operating system level, you will get a secret weapon in your hands that allows you to quickly find and remove almost any bottleneck of a high-load web project!
Total
- We repeated the basic methods and tools for debugging PHP web applications of any degree of complexity.
- We considered the options for organizing a simple and effective business process of finding problems on combat servers.
- We learned how to catch "complex" cases and bottlenecks using xhprof and strace on "combat" servers.
- We tasted the linux system calls and learned how to interpret them.
Good luck to everyone, stable web projects, reliable hosting and a relaxing, serene vacation! And, of course, I invite everyone to our new cloud project deployed in the Amazon - “Bitrix24” !
Source: https://habr.com/ru/post/144482/
All Articles