The whole truth about Chrome (and not only) Web Inspector. Part 1
I will try to make the most complete and detailed description of the Web Inspector features in Russian.
In the first series, we climbed into the settings, see what the console can do and play around with the Elements panel.
Since the Web-Inspector is not translated into Russian, I will keep the original name.
As a bonus, I will attach a screenshot of one and the very first versions, from the distant 2006th.
')

Now there are several versions of Web Inspector:
I will use Google Chrome Canary Build , and if Web Inspector is your main debugging tool, I recommend this version (If you are not on Windows, download Chromium )
Almost everything described here, however, will work in other versions of Web Inspector.
There are several ways to open the Web Inspector:
All new tools first fall into the "experimental features." To enable them, go to "about: flags", find the option Enable Developer Tools experiments there.
After that, restart the browser.
I will look at experimental features in one of the following articles.
Let's open the settings dialog by clicking on this button. , in the lower right corner and see what is interesting there.

Fixes Web Inspector on the right side of the page.
On large monitors, this allows for better use of horizontal space, and also makes it easy to change the width of the visible area of the browser, which is useful for quick testing of media queries.
By default Web Inspector bottom. You can pull it into a separate window by clicking on
Turns off the cache. A very useful option when debugging scripts and styles.
You can also clear the cache from the Network panel by right-clicking there and selecting Clear Browser Cache.
I want to mention this feature here, because it appeared quite recently. She ... turns off Javascript .
More serious way to test media queries (English) . Allows you to set the width and height of the screen, as well as the font scale. Ideally, I would like some ready-made presets for popular mobile platforms.
Allows you to emulate touch-events. Useful for testing mobile apps.
Imagine that you could upload a minified / assembled / compiled version of the script to the site, and the browser itself could find the source code for debugging.
Source maps (English) , allow the browser to specify the way to find the source file.
The idea is excellent, but so far only allows you to work with Javascript .
In the future, promise to support CoffeeScript , LESS , SASS and other miracle technologies.
Displays XHR requests in console . (eng.)
If this option is selected, the contents of the console will be saved even when the page is refreshed.
To view the list of hot keys, open any tab except the console and click on the " ? " (In English layout).
Everything is pretty obvious here, it is important to know that autocompletion works almost everywhere.
The console allows you to enter and execute any Javascript commands. If you want to write an expression of several lines, use SHIFT + Enter .
A separate tab is highlighted for the console, but it actively interacts with others, so you can call it from any other tab by pressing the Esc key . At the same time, the text you started to dial is saved.
As elsewhere, there is autocompletion in the console. At first, it may not be entirely obvious how it works.
You can choose exactly what you want to see in the console using this panel below:

You can select two items by holding CTRL . Here you can choose the frame with which we want to work.
If you have installed extensions containing errors, these errors will be constantly displayed in the console.
Unfortunately, at the moment there is no easy way to turn them off. As temporary measures, you can:
For some reason, CTRL + Scroll in the console does not work.
But you can use CTRL + to increase the font, CTRL - to reduce and
CTRL + 0 for the original scale.
The console has its own commands. Since Web Inspector is written in JS, a list of all commands can be viewed in the console itself by entering console._commandLineAPI . Let's look at the most interesting ones.
There are several ways to clear the console:
In variables $ 0 - $ 4 - The last five selected items, in order of choice.
Any DOM element displayed in the console can be opened in the Elements tab by right-clicking.
The console supports several additional ways to select items, without any additional libraries.
Please note that if the site uses some kind of Javascript library, then these functions
can be overwritten. For example, on Habré $ this is jQuery .
There are several functions that can learn more about the element. Basically, they duplicate the functionality of the panels from the “Elements” tab.
You can monitor everything that happens to an element using themonitorEvents (element) function .
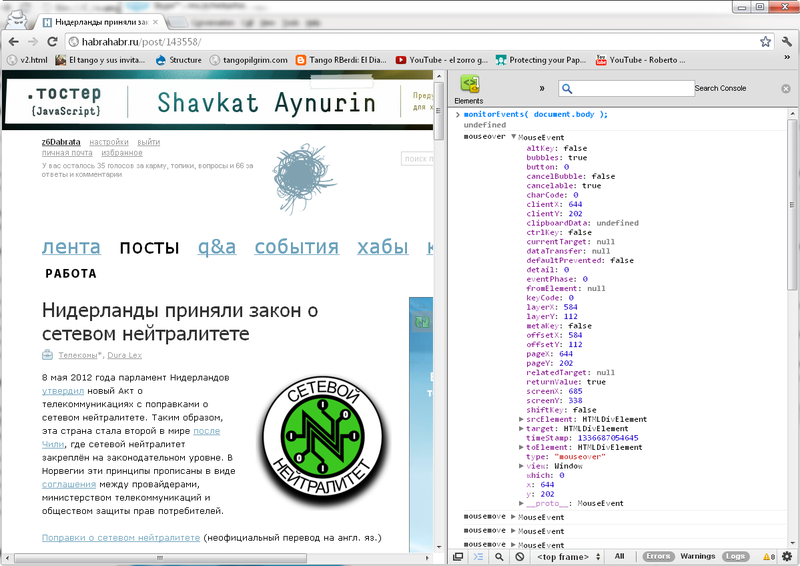
Using the second argument, you can choose the type of events that you follow:
You can stop this madness with the unmonitorEvents (element) function .
The result of any expression can be immediately copied to the clipboard using the Copy () function. Nice and can save some time.
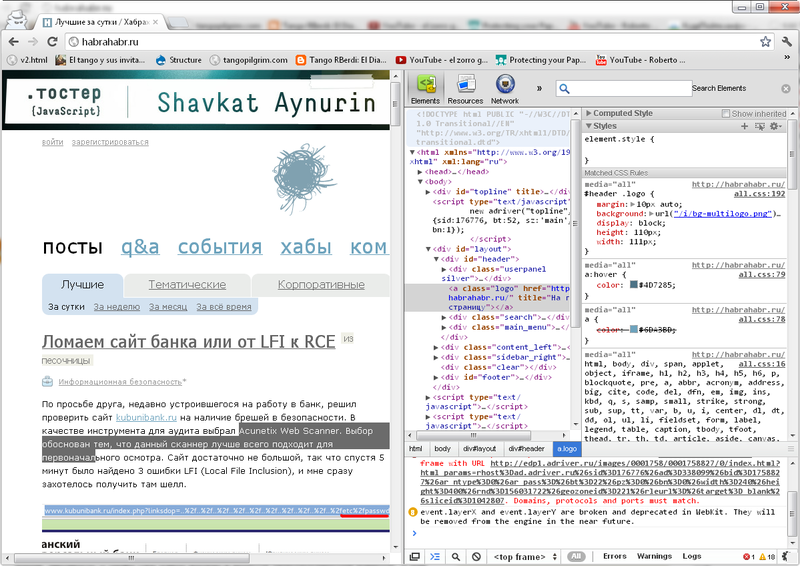
This panel contains all the DOM-Tree of our page, updated in real time.
Every time elements change on the page, they are updated in the tree and vice versa.
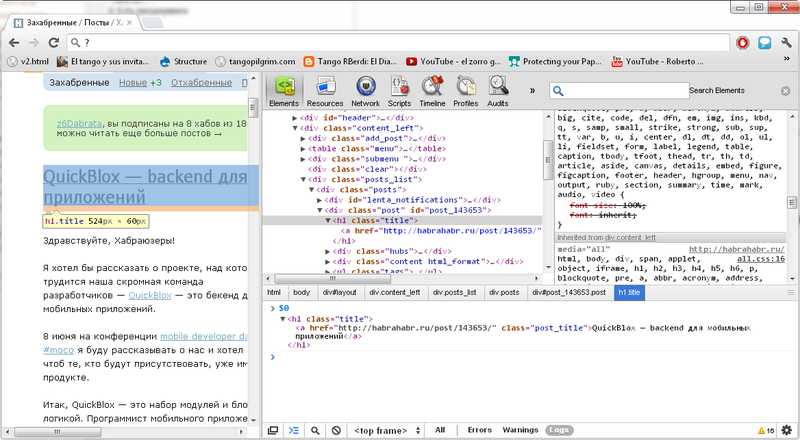
If you want to select an element from the document, click the button with a magnifying glass at the bottom or CTRL + SHIFT + C and select any element.
When you hover the mouse, CSS will be shown, up to the element, its dimensions and indents.
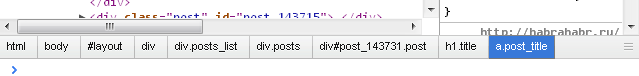
At the very bottom of the panel you can see the path to the Element. You can select any parent element by clicking on it.
You can move around the tree with arrows (if you are in another section, you can return the focus using CTRL + up / down ).
To change any attribute or value, double click on the element, or press Enter
and reach it using the Tab button ( SHIFT + Tab ) .
You can also change the entire HTML code of the element by pressing F2 .
You can drag items with a mouse from one container to another and they are automatically transferred to the document itself.
Also, any element can be dragged into your text editor. True, only the code of the element itself will be copied, all that is embedded in it will be lost.
By clicking on the element of the right mouse button, you can copy its HTML code, or XPath path and set DOM breakpoints.
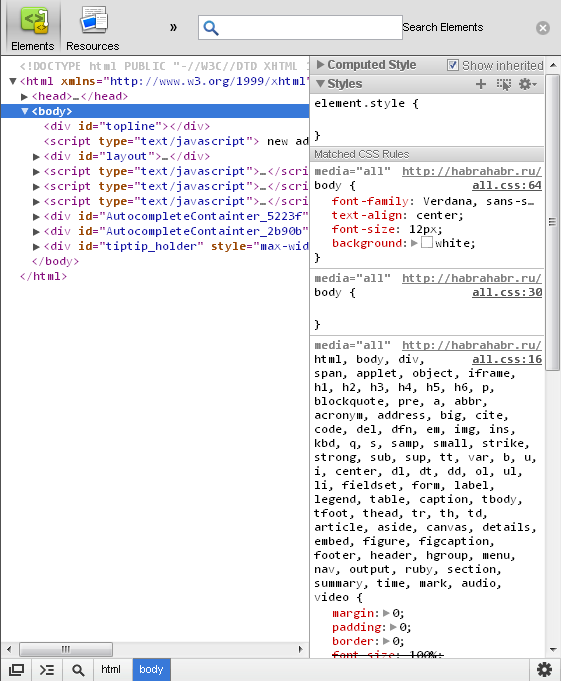
Selecting an item, you can see information about it in the panel on the right.
List of CSS styles applied to the element. If you check in “Show inherited”, then all styles, including browser styles will be displayed.
List of rules applied to the item. They can be changed and changes instantly appear in the document.
It is important to understand that all changes will be lost after updating the browser. .
You can turn off any expression by removing the checkbox from the checkbox on the left.
The element.style section shows styles specified in the style attribute in the HTML code of the document.
and the Matched CSS Rules section shows all the selectors defined in the CSS files and matched with the selected element.
You can move between properties and values using the Tab Key ( SHIFT + Tab ) to go back).
You can add your selector by clicking on the button. , and then you can not delete.
You can add a new expression to an existing selector by clicking on the closing curly bracket of the rule (or by starting to change the last expression, press Tab ).
Clicking this button , and having put down daws, you can set the pseudo-classes to the element : active ,: focus,: hover and : visited .
Pressing the button with gear As authored - will show the colors in the format in which they were set.
Numeric values can be changed using the keyboard.
If you click on the box next to the color, you can choose a color from a convenient dialogue. By clicking on the numeric value, you can enter the color manually.
Here you can see the dimensions and indents of the element (And if the element is given a position, then the position).
You can change any value here by clicking on it twice.
Interestingly, all dimensions are shown in pixels, even if you set dimensions in EM, they will be converted to pixels automatically.
This section shows all the properties of the object, which is probably useful for educational purposes. They can also be changed, but this has never been useful to me.
Here is a list of installed Dom Breakpoints. You can quickly find an item by clicking on the name, turn off breakpoint, uncheck the box, remove breakpoint by clicking on it with the right mouse button.
DOM Breakpoint allows you to track changes that occur with a DOM element or its attributes. We will deal with them in more detail when we get to debug scripts.
Web Inspector allows us to easily modify the <font color> css code. Unfortunately, there is no easy way to save changes quickly. There are several options
Links in random order, unfortunately, everything is in English.
This is only the first part of the article. Stay with us and you will find out
I often use Web Inspector in my work, but there may be things that I do not know, or have forgotten to mention, so I will be happy with any corrections or additions.
Until the next episode!
In the first series, we climbed into the settings, see what the console can do and play around with the Elements panel.
Since the Web-Inspector is not translated into Russian, I will keep the original name.
As a bonus, I will attach a screenshot of one and the very first versions, from the distant 2006th.
')
What version to use?
Now there are several versions of Web Inspector:
- All the latest features get Google Chrome Canary Build .
- When everything stabilizes, they are added to WebKit Nightly builds , and then to Google Chrome Stable .
- Safari in this sense is the most conservative browser and lags behind Google Chrome Canary Build by about a year.
I will use Google Chrome Canary Build , and if Web Inspector is your main debugging tool, I recommend this version (If you are not on Windows, download Chromium )
Almost everything described here, however, will work in other versions of Web Inspector.
Launch Web Inspector
There are several ways to open the Web Inspector:
- Control + SHIFT + I - Opens the toolbar.
- Control + SHIFT + J or F12 - Opens the console
- Control + SHIFT + C - Allows you to select an element using the mouse in the document itself and open it in the Elements tab
- You can click on any element on the page with the right mouse button and select "Inspect Element (View Element Code)".
- You can open Web Inspector from the menu: Icon with key -> Tools -> Developer Tools (Tools -> Developer tools)
You can open Web-Inspector for Web Inspector, for this you need to open it in a separate window:
404tesla
Configure Web Inspector
Experimental functions
All new tools first fall into the "experimental features." To enable them, go to "about: flags", find the option Enable Developer Tools experiments there.
After that, restart the browser.
Be careful with the experimental features, they may not work as expected and cause errors.
I will look at experimental features in one of the following articles.
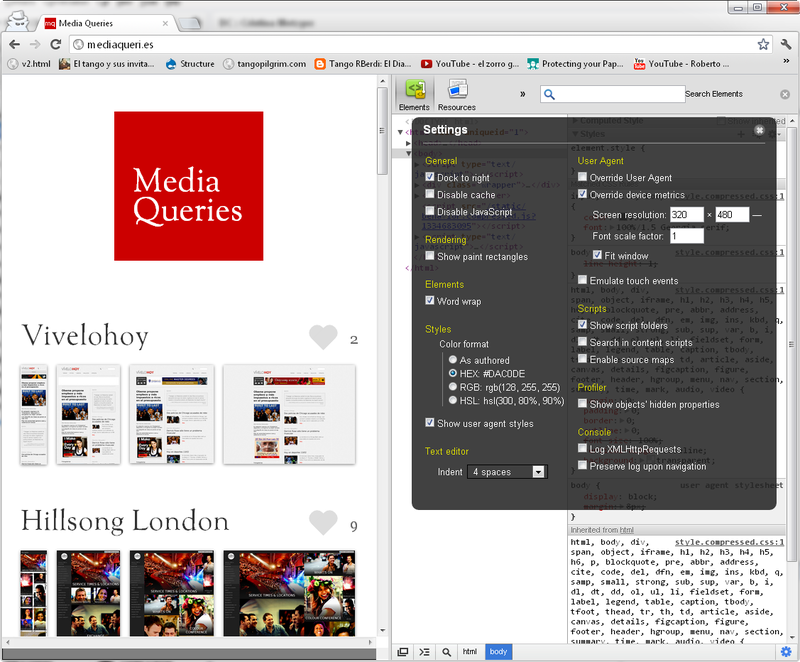
Settings
Let's open the settings dialog by clicking on this button.
, in the lower right corner and see what is interesting there.Dock to the right
Fixes Web Inspector on the right side of the page.
On large monitors, this allows for better use of horizontal space, and also makes it easy to change the width of the visible area of the browser, which is useful for quick testing of media queries.
By default Web Inspector bottom. You can pull it into a separate window by clicking on
Disable cache
Turns off the cache. A very useful option when debugging scripts and styles.
You can also clear the cache from the Network panel by right-clicking there and selecting Clear Browser Cache.
Disable JavaScript
I want to mention this feature here, because it appeared quite recently. She ... turns off Javascript .
Override device metrics
More serious way to test media queries (English) . Allows you to set the width and height of the screen, as well as the font scale. Ideally, I would like some ready-made presets for popular mobile platforms.
Emulate touch events
Allows you to emulate touch-events. Useful for testing mobile apps.
Enable source maps
Imagine that you could upload a minified / assembled / compiled version of the script to the site, and the browser itself could find the source code for debugging.
Source maps (English) , allow the browser to specify the way to find the source file.
The idea is excellent, but so far only allows you to work with Javascript .
In the future, promise to support CoffeeScript , LESS , SASS and other miracle technologies.
Log XMLHttpRequests
Displays XHR requests in console . (eng.)
Preserve log upon navigation
If this option is selected, the contents of the console will be saved even when the page is refreshed.
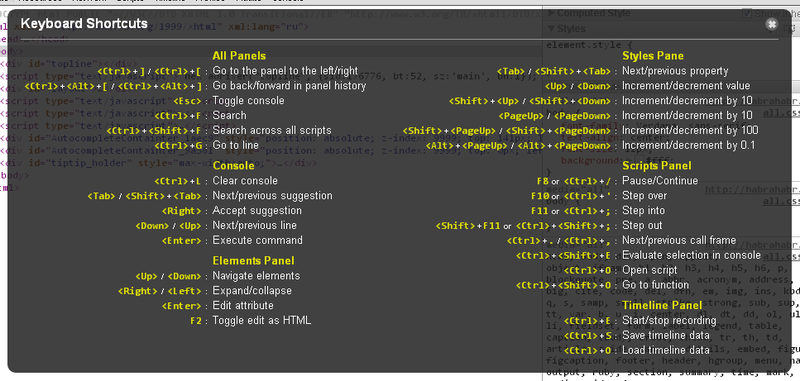
Hotkeys
To view the list of hot keys, open any tab except the console and click on the " ? " (In English layout).
Please note that if the window does not fit completely, it is cut off and can hide some of the information.
Everything is pretty obvious here, it is important to know that autocompletion works almost everywhere.
Console
The console allows you to enter and execute any Javascript commands. If you want to write an expression of several lines, use SHIFT + Enter .
A separate tab is highlighted for the console, but it actively interacts with others, so you can call it from any other tab by pressing the Esc key . At the same time, the text you started to dial is saved.
The console can be used not only for its intended purpose.If you know any other nontrivial ways to use the console, please mark in the comments, I will be very grateful to you.
- It perfectly helps as a calculator, with simple calculations.
- As a die: Math.ceil (Math.random () * 6)
- As a quick record book: localStorage.setItem (0, “Phone Number”);
As elsewhere, there is autocompletion in the console. At first, it may not be entirely obvious how it works.
- Tab only works when only one option is left.
- If there are several options, you can select any and click right (or just click with the mouse)
What to show
You can choose exactly what you want to see in the console using this panel below:
You can select two items by holding CTRL . Here you can choose the frame with which we want to work.
Get rid of error messages in extensions
If you have installed extensions containing errors, these errors will be constantly displayed in the console.
Unfortunately, at the moment there is no easy way to turn them off. As temporary measures, you can:
- Run Chrome in Incognito Mode ( CTRL + SHIFT + N )
- Use another profile for laying, without extensions. For this you need another google account. To add a profile, click the icon with a wrench -> Settings -> add user (settings add user).
Change the font size
For some reason, CTRL + Scroll in the console does not work.
But you can use CTRL + to increase the font, CTRL - to reduce and
CTRL + 0 for the original scale.
It only works for me in Chrome Canary build, in the stable version only the document itself is incremented.
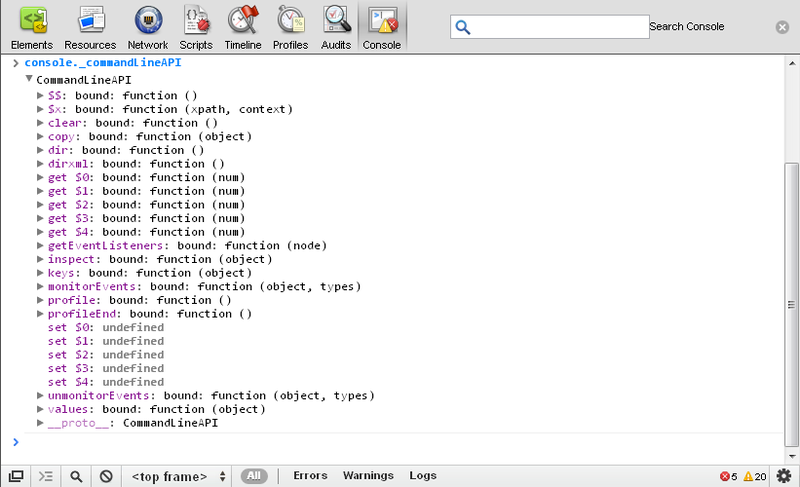
Console commands
The console has its own commands. Since Web Inspector is written in JS, a list of all commands can be viewed in the console itself by entering console._commandLineAPI . Let's look at the most interesting ones.
Clearing the console
There are several ways to clear the console:
- Command clear ();
- CTRL + L (This combination in Chrome moves the focus to the address bar. If it does not work in the console, click anywhere in the document, and then click on the console).
- Right click and select “Clear console”
Interaction with the Elements tab
In variables $ 0 - $ 4 - The last five selected items, in order of choice.
Any DOM element displayed in the console can be opened in the Elements tab by right-clicking.
Select items
The console supports several additional ways to select items, without any additional libraries.
- $ ("ID") - Select the item by ID.
- $$ ("selector") - Select an element by CSS selector.
- $ x ("selector") - Element selection by XPath- selector .
Please note that if the site uses some kind of Javascript library, then these functions
can be overwritten. For example, on Habré $ this is jQuery .
We study objects
There are several functions that can learn more about the element. Basically, they duplicate the functionality of the panels from the “Elements” tab.
- inspect () - Opens the DOM-Tree and finds an element there
- dirxml () - Displays the item as xml
- dir () - Displays a list of item properties.
- keys () - selects all keys from the dir () list
- values () - Selects all values from the dir () list.
We follow the events
You can monitor everything that happens to an element using the
Using the second argument, you can choose the type of events that you follow:
- "mouse" - for mousedown , mouseup , click , dblclick , mousemove , mouseover , mouseout , mousewheel
- "key" - for keydown , keyup , keypress , textInput
- "touch" - for touchstart , touchmove , touchend , touchcancel (If enabled in the settings)
- "control" - for resize , scroll , zoom , focus , blur , select , change , submit , reset
- If you do not specify the second argument, then all the above events, plus load , unload , abort , error , select , change , submit , reset , focus , blur , resize , scroll , search , devicemotion , deviceorientation .
You can stop this madness with the unmonitorEvents (element) function .
Copy the information to the clipboard
The result of any expression can be immediately copied to the clipboard using the Copy () function. Nice and can save some time.
Elements Tab
This panel contains all the DOM-Tree of our page, updated in real time.
Every time elements change on the page, they are updated in the tree and vice versa.
If you want to select an element from the document, click the button with a magnifying glass at the bottom or CTRL + SHIFT + C and select any element.
When you hover the mouse, CSS will be shown, up to the element, its dimensions and indents.
Path to the item
At the very bottom of the panel you can see the path to the Element. You can select any parent element by clicking on it.
Working with wood
You can move around the tree with arrows (if you are in another section, you can return the focus using CTRL + up / down ).
Editing
To change any attribute or value, double click on the element, or press Enter
and reach it using the Tab button ( SHIFT + Tab ) .
You can also change the entire HTML code of the element by pressing F2 .
You can select any item and delete it by pressing Delete , which is very useful for killing ads missed by the ad block.
Drag & drop
You can drag items with a mouse from one container to another and they are automatically transferred to the document itself.
Also, any element can be dragged into your text editor. True, only the code of the element itself will be copied, all that is embedded in it will be lost.
Context menu
By clicking on the element of the right mouse button, you can copy its HTML code, or XPath path and set DOM breakpoints.
detailed information
Selecting an item, you can see information about it in the panel on the right.
Computed style
List of CSS styles applied to the element. If you check in “Show inherited”, then all styles, including browser styles will be displayed.
Styles
List of rules applied to the item. They can be changed and changes instantly appear in the document.
It is important to understand that all changes will be lost after updating the browser. .
You can turn off any expression by removing the checkbox from the checkbox on the left.
The element.style section shows styles specified in the style attribute in the HTML code of the document.
and the Matched CSS Rules section shows all the selectors defined in the CSS files and matched with the selected element.
You can move between properties and values using the Tab Key ( SHIFT + Tab ) to go back).
Adding rules and expressions
You can add your selector by clicking on the button.
, and then you can not delete.You can add a new expression to an existing selector by clicking on the closing curly bracket of the rule (or by starting to change the last expression, press Tab ).
Pseudo-classes
Clicking this button
, and having put down daws, you can set the pseudo-classes to the element : active ,: focus,: hover and : visited .Display colors
Pressing the button with gear
As authored - will show the colors in the format in which they were set.Change numeric values
Numeric values can be changed using the keyboard.
- Alt + Up / Down changes the value by 0.1
- Up / Down changes the value by 1
- SHIFT + Up / Down or Page Down / Page Up changes the value by 10
- SHIFT + Page Down / Page Up changes the value to 100.
If you click on the box next to the color, you can choose a color from a convenient dialogue. By clicking on the numeric value, you can enter the color manually.
Metrics
Here you can see the dimensions and indents of the element (And if the element is given a position, then the position).
You can change any value here by clicking on it twice.
Interestingly, all dimensions are shown in pixels, even if you set dimensions in EM, they will be converted to pixels automatically.
Properties
This section shows all the properties of the object, which is probably useful for educational purposes. They can also be changed, but this has never been useful to me.
Dom breakpoints
Here is a list of installed Dom Breakpoints. You can quickly find an item by clicking on the name, turn off breakpoint, uncheck the box, remove breakpoint by clicking on it with the right mouse button.
DOM Breakpoint allows you to track changes that occur with a DOM element or its attributes. We will deal with them in more detail when we get to debug scripts.
Saving changes
Web Inspector allows us to easily modify the <font color> css code. Unfortunately, there is no easy way to save changes quickly. There are several options
- Just copy all changes to your IDE.
- Changes in CSS (except for newly created rules) are saved in the appropriate files. By clicking on the "file name: line number" to the right of the selector
- There is an extension from ELV1S : ChromeDevtools Autosave (English) , it works only locally and requires to install the server (English) on Node JS (English), but it allows you to save changes to JS and CSS automatically.
What's next?
Some useful links
Links in random order, unfortunately, everything is in English.
- Peter Beverloo (eng.) - In detail and regularly about new features of Chromium
- Chrome Developer Tools (eng.)
- About Safari Developer Tools (eng.)
- - Modern Web Development (eng.) A good, and very detailed article about Web Inspector.
- monitorEvents (English) - A little bit about monitorEvents
- Youtube channel from Chrome developers (eng.)
- Source Codes
- Bugtreker (eng.)
- Paul Irish (Eng.) - Paul Irish, is promoting Chrome Dev Tools, there are good articles
In the next series
This is only the first part of the article. Stay with us and you will find out
- What do the remaining 5 panels.
- Debugging Javascript , debugger; and console commands
- How to get Base64 code for pictures using Web Inspector.
- Who are "Show shadow DOM", "Snippets support" and "Show styles panel"
- How to turn a minified version of a script into a beautiful one.
- How to debug our code using JS, DOM, XHR and Event Listener break points.
- How to properly and efficiently use the console from our scripts?
- How to debug apps for iPad / Iphone / Androind smartphone using Web Inspector?
- How to connect the console to my favorite Coffee Script? And to show in the console PHP errors?
- What a new plugin API for Web Inspector, and what to do with it.
- How to view HTTP requests.
- How come dev-tools are not translated into Russian.
I often use Web Inspector in my work, but there may be things that I do not know, or have forgotten to mention, so I will be happy with any corrections or additions.
Until the next episode!
Source: https://habr.com/ru/post/143767/
All Articles