Cacti Weathermap: network visualization + interactive

In this post I want to acquaint readers with a wonderful plugin for the monitoring system Cacti - Weatnermap. Personally for myself, of all the variety of useful additions to Cacti, I consider the Weathermap most useful. With its help, the administrator is able to create network cards (physical, logical or just a separate section and / or nodes), the main purpose of which is to visualize the loading of network interfaces (although it is thus possible to visualize any graph).
I'll tell you how to install the plugin, configure it, analyze the map configuration.
')
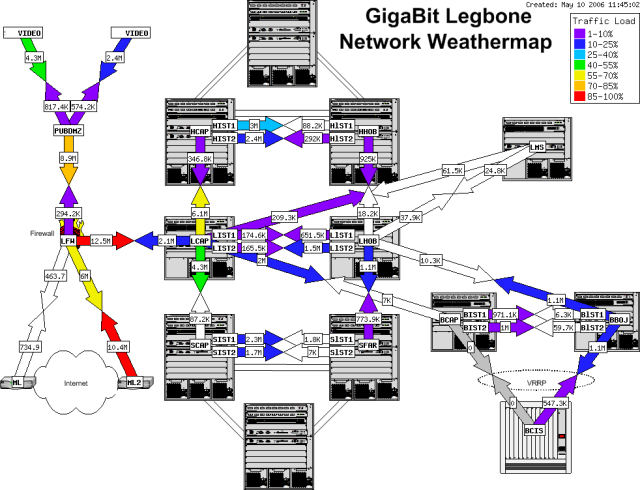
It seems to me that if you look at a couple of graphs, then everything will become much clearer than I will try to tell. To demonstrate the possibilities, some maps are taken from the Internet.
Example number 2:
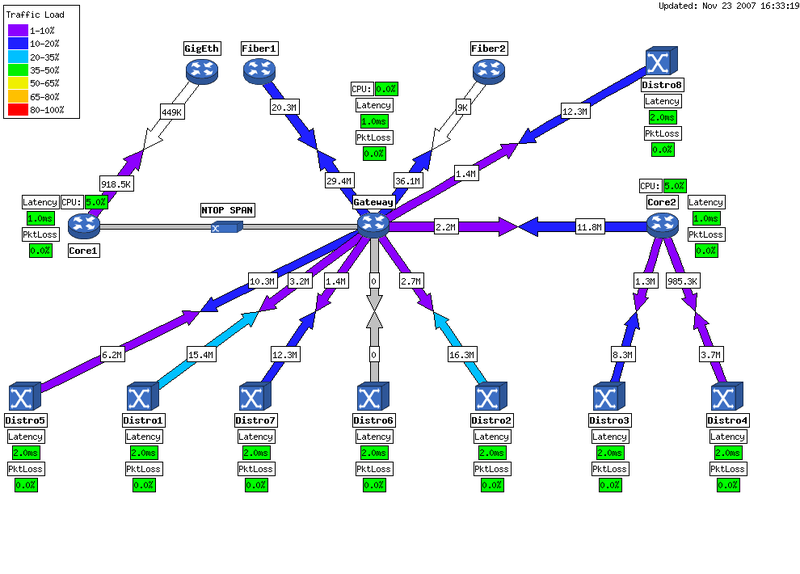
Example number 3:
Installation
To install the plug-in, we need to implement two things: install the plug-in architecture and install the Cacti plug-in itself. If you have already installed any plugins, then you can safely skip the architecture installation section.
1. Installing Plugin Architecture
1.1. Download Plugin Architecture Plugin Architecture (PIA) .
1.2. In the archive we will find the files folder, and two files pa.sql and cacti-plugin-0.8.7h-PA-v3.0.diff (the name of the patch depends on the version of the downloaded architecture, at the time of writing - the last one).
1.3. Copy everything from the files directory to the folder with Cacti installed (I have (Debian) - / usr / share / cacti / site /). Copy patch cacti-plugin-0.8.7h-PA-v3.0.diff to this folder.
1.4. Patching #patch -p1 -N <cacti-plugin-0.8.7h-PA-v3.0.diff.
1.5. We make changes to the database - #mysql –u cactiuser –p cacti <pa.sql. Where, cactiuser is a database user cacti.
1.6. Adjust the paths in the /usr/share/cacti/site/include/global.php file (in your version * nix, the paths may be different):
change the path to the RRA database:
$config["rra_path"] = $config["base_path"] . '/rra';on
$config["rra_path"] = '/var/lib/cacti/rra';and install the adodb module:
include_once($config["library_path"] . “/adodb/adodb.inc.php”);on
include_once(“/usr/share/php/adodb/adodb.inc.php”);changing the URL-path (I have Cacti available at domain.com/cacti/):
$url_path = ““;on
$url_path = “/cacti/“;1.7. In the file /usr/share/cacti/site/include/config.php (or /etc/cacti/debian.php - it is connected in config.php) we add:
$plugins = array();
$plugins[] = 'weathermap';
Now when you need to add a plugin - you will simply add one line to the configuration.
Attention! It is recommended to install the plug-in architecture on the newly installed Cacti. I installed on both the newly installed Cacti and working (in particular for this post). If you install the architecture on a working Cacti, then after performing the steps in section 1 and opening the domain.com/cacti page in the browser, you will see the installation dialog for the cactus. Do not be alarmed and in the drop-down list select not “New install”, but “Upgrade”. Click “Next” and everything will be fine. But in any case, do not forget about backup copies of the database and files!
2. Installing Weathermap
This stage is the easiest. All the main task we performed in section №1.
2.1. Download Weathermap - http://www.network-weathermap.com/download .
2.2. Unpack the archive into the folder with the plugins: / usr / share / cacti / site / plugins /.
If in the future we want to add more plugins, it will only be necessary to unpack them in this folder and add a line to the configuration (
$plugins[] = 'weathermap'; ).If you did everything right, you should see something like this:
Customization
1. Creating a map.
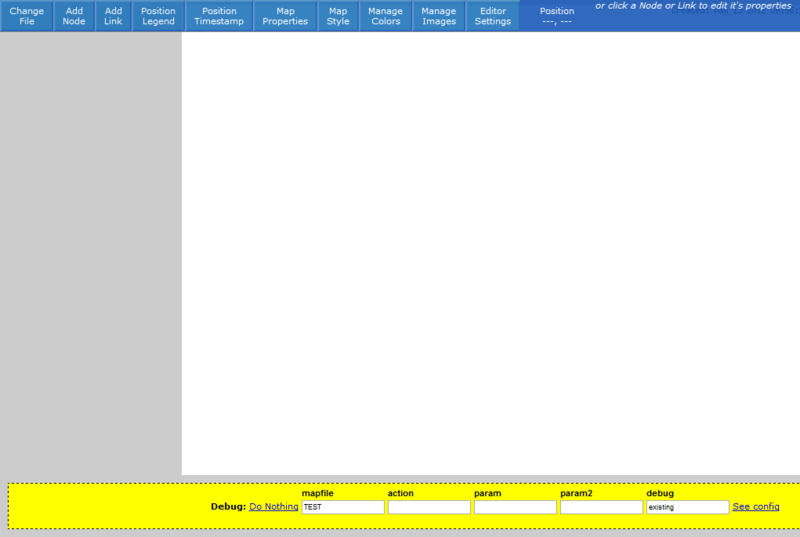
To create a map, you must use the editors. To activate it, set $ ENABLED = true in the file /usr/share/cacti/site/plugins/weathermap/editor.php. The editor looks like this:
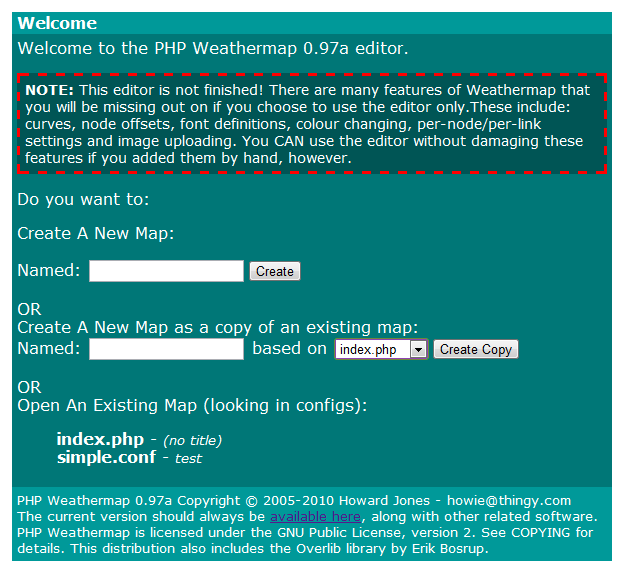
In the editor, you can create a map from scratch or as a copy of an existing one.
2. The map editing window looks like this:
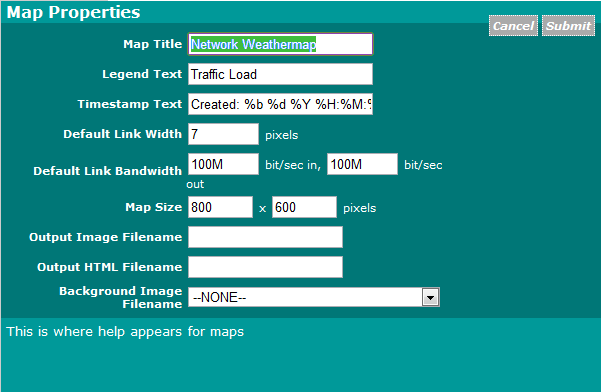
Using the main menu it is possible: to set the map parameters (size, background, captions, legends, styles, designs):
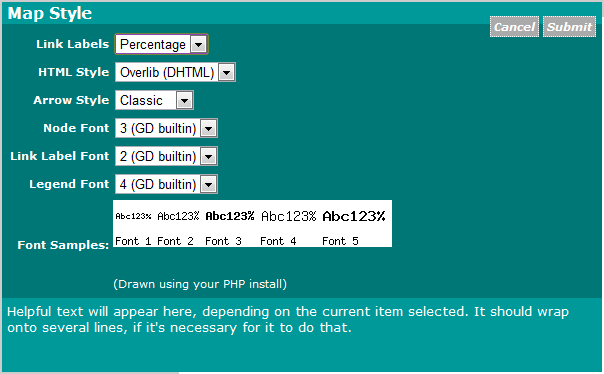
If we are not satisfied with the set of standard backgrounds, then you can upload your own. This is done by placing the image in the / usr / share / cacti / site / plugins / weathermap / images / folder.
3. Adding items to the map.
The main elements of the map are nodes (nodes, nodes) and links (links). Equipment on the map is displayed by the nodes. It should be noted that the main parameter of the node is its image. The standard set is not rich, but if you need your own image for the node, you can upload it to the / usr / share / cacti / site / plugins / weathermap / images / folder.
Nodes communicate with each other by links. To add a link, we click on the button “Add Link” in the main menu, then on the first device and on the second. I want to note that the order of pressing on devices is important. The fact is that we added the link, but it is not tied to any of the graphs:
To bind, we click on the links and select the source - the graph from Cacti:
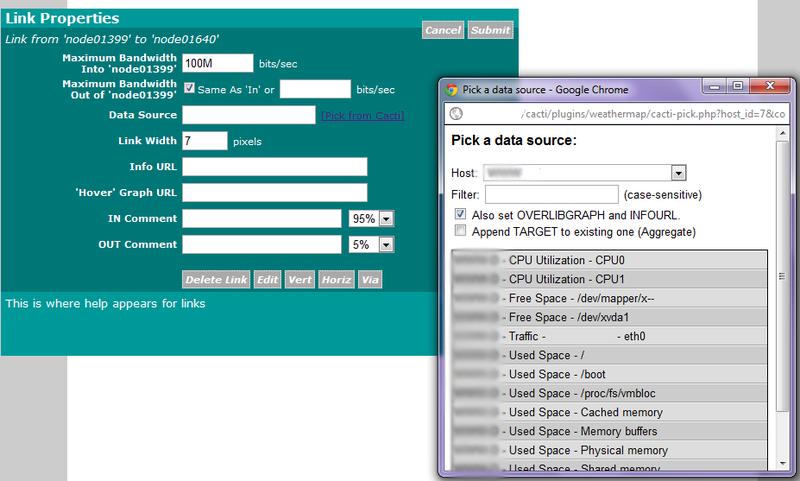
So, the source should be the device on which we clicked first when building a connection. If you select a second device, then the load on the links will be mirrored (with a large return of traffic will show an increase in incoming traffic).
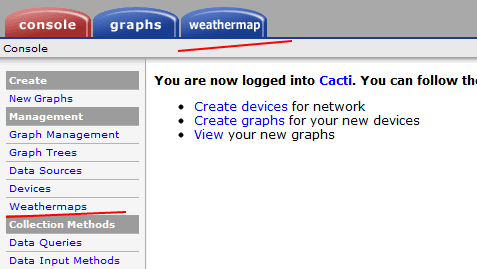
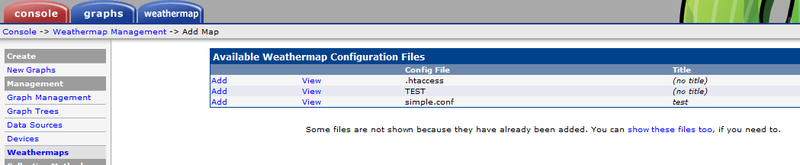
You don't need to save the card in any way. When creating a map, a configuration file of the map is created (in our case / usr / share / cacti / site / plugins / weathermap / configs / TEST, TEST is the name of the map). To display a map in Cacti itself, you must add its list of displayed maps. For this: Console-> Weathermap-
> Add, select the created map and click Add again:
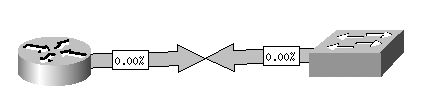
If after that you click on the Weathermap tab, you will see our map (it is created within 5 minutes after poller has been working). An example is elementary, but sufficient to understand how to create a map:
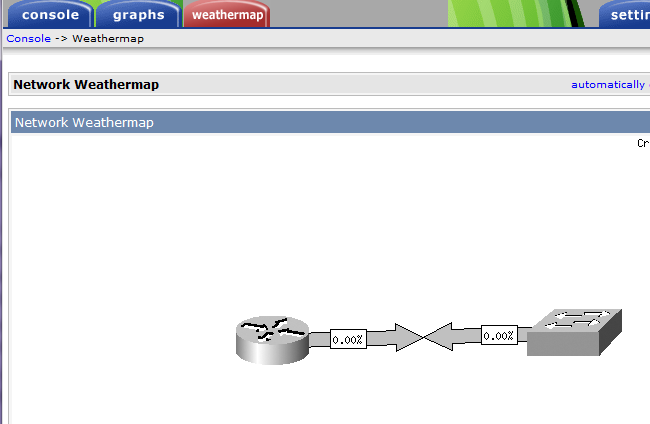
The map was created and we can observe the download links. But in order to find out the specific values, it is necessary to click directly on the link and a transition to a specific graph in Cacti will occur. I will say that it is not convenient. It is much more convenient to get the values just by moving the mouse to the graph. This is configured as follows. The line
HTMLSTYLE overlib added to the configuration file (/ usr / share / cacti / site / plugins / weathermap / configs / TEST). And it looks like this:
An example of the configuration file can be found here ( http://pastebin.com/zJT9hUw2 ). There is nothing difficult in the structure. Coordinates of nodes, links, binding of lines to specific graphs and general map parameters (sizes, colors, types of fonts, etc.) are described.
Thanks to the modular architecture, Cacti easily expands, and not a small set of plug-ins (please note free ones) allows you to organize a good monitoring of many parameters of various equipment.
Sources
1. One of the very first / interesting entries. forum.lissyara.su/viewtopic.php?f=3&t=10317 .
2. Page dedicated to Weathermap. www.network-weathermap.com .
3. A set of plug-ins. docs.cacti.net/plugins .
4. Branch of the forum, where weathermap is actively discussed. forums.cacti.net/viewtopic.php?f=16&t=24433 .
Other interesting links
1. For those who are just starting. habrahabr.ru/post/71087 .
2. Alert system in cacti. habrahabr.ru/post/56345 .
3. Statistics nginx in cacti. habrahabr.ru/post/66605 .
4. Lighttpd statistics in cacti. habrahabr.ru/post/66602 .
5. Cacti and Network UPS Tools. habrahabr.ru/post/105308 .
Source: https://habr.com/ru/post/143747/
All Articles