Handling complex events with chains
This article describes a method for handling complex events using chains. As a practical application, a relatively simple task was chosen - forecasting the movement of the exchange rate.
In constructing the chains, the methodology described in the article “Automatic analysis of texts without moderators” and in comments to it was used. After the description of the algorithm, a strategy with a positive expectation of profit will be proposed.
When processing events, one has to look for a meaning. If the sun shines from the sky and the southwest wind blows, what does this mean? And if deaf peals suddenly became dark and audible, then how does this threaten?
The answer to these questions lies in the future. If the weather is good now, then you can go for a walk. And if the clouds suddenly thickened, then it is necessary to prepare for the rain. Thus, events from the present become prerequisites for shaping the future.
')
But the future does not exist. Even if it is predetermined, a factor that can change the result to some degree or other can always appear. You can only talk about a certain probability with which the forecast is executed.
When forecasting it is necessary to operate with a limited set of information. The more of it, the more time is spent on processing. The need for processing deliberately makes instant reaction impossible. Even if the processing takes seconds, but in a second much that can happen. And the more complicated the methods involved, the greater the gap between the appearance of the initial data and the end result.
Another factor is that the behavior of the environment is not always determined and determined. This forces us to resort to empirical methods of research: first we fix the prerequisites, and then associate them with the consequences that have occurred. The time between cause and effect gives an additional delay.
If the behavior of the environment does not depend on its past states, then its prediction is impossible - you never know what will happen in the next moment. But in practice, stable cause-and-effect relationships still occur and sometimes exist from time immemorial.
Thus, the task is reduced to the collection of necessary information, an empirical search for stable causal relationships and the use of results in forecasting.
Let us try to predict the direction of movement of the EURUSD rate on the FOREX market. We take the story in the form of one-minute bars and try to predict: will the price go up, or will the price go down? If there is no certainty in either, then we give an indefinite answer. The obtained answers are then compared with the real result and we find out if the prediction was correct or not.
The MetaTrader 4 or 5 Strategy Tester is suitable as a platform for implementation. The fifth version is more preferable, as it supports Object-Oriented Programming, but it is quite possible to get by with the fourth one.
Those who are familiar with the FOREX market and have dealt with Mechanical Trading Systems advisers are well aware of what is at stake. The tester consistently goes through history, creating trading conditions that are close to reality and gives an assessment of the effectiveness of the adviser.
When solving a problem, I implemented my tester in Java, which turned out to be justified for me.
Next, we implement the chain construction algorithm and use it for prediction.
As a result, it is necessary to conclude: is it possible to forecast in the FOREX market and is the chain building method justified?
When testing, we determine the number of pips of the minimum income (MinProfit), maximum loss (MaxLoss) and set the amount of time for which we want to see the result (FeedbackHours). The last parameter is the delay between the appearance of the original data and their use in forecasting. To get closer to real conditions, we also take into account the spread (Spread).
The parameters can be varied in a wide range, MinProfit and MaxLoss can be taken different from each other. When solving the task, the following parameter values were chosen:
MinProfit - 200 pips
MaxLoss - 200 pips
FeedbackHours - 24 * 7 hours
Spread - 30 pips
The MinProfit and MaxLoss parameters are not taken too long, so that the testing time is not too long. With such parameters, the strategy will resemble pipsing. Getting a steady income from pipsing is the dream of almost all traders. Let's try to help them.
The FeedbackHours parameter is chosen not too small, since with a smaller value, the result does not always have time to form. If we consider that the goal is to search for long-term trends, then we can take large values without serious consequences. However, by reducing the waiting time for a result, you can gain an advantage in time.
Spread sets a commission for each operation. The traditional value was chosen, which is quite acceptable for solving the set task. If desired, it can be taken even zero.
When testing, the one-minute story for 2010-2011 was taken from the servers of InstaTrader and MetaQuotes. It was technically difficult for me to do testing over a wider range (more than two years).
The accepted values set the probability of winning if the price moves randomly at the level of 17/43 (approximately 0.3953).
If the expert's advantage is close to this value, then we can say that the efficiency of the method is zero. Such a result will indirectly indicate that, within the parameters adopted, the behavior of the EURUSD price on the FOREX market is completely random. To change the situation it is necessary to change the parameters.
If the result obtained is less than this value, then the method should be oriented precisely to the contrary. That is, if the result is “Buy”, then you need to sell, if you get “Sell”, then you need to buy.
If the result is greater than 17/43, then we can say that the method is effective and its development can bring results.
But even if the probability of winning is more than 0.5, it will be a mistake to assume that the so-called “grail” has been found. The profitable method will spread very quickly and its advantages will be very quickly exhausted ( 1 , 2 ).
This, in fact, is the ultimate goal of this work. If statistical methods no longer justify themselves, then every opportunity for speculation will disappear.
First made a rough estimate. That is, at every step the expert says “Buy” and “Sell” at the same time. The resulting gain gives information about trends in price behavior. If the winning is close to 0.3953, then we can say that there is no certainty. If it is more than 0.3953, then the price movement is subject to trends, if less, the movement is horizontal.
Moreover, if the deviation in one direction or another is large enough, then strategies will be justified in which MinProfit is not equal to MaxLoss.
Practical research has shown that in 2010–2011, a gain of 0.4250 was obtained, which is better than a gain at a random price of 0.0297. The increase in the gain is quite noticeable, and it was observed throughout the testing time.
Hereinafter, the standard deviation value is not given, since it was not calculated. For all the importance of this parameter, in this evaluation work it was ignored.
A rough estimate was also carried out for the period from 2000 to 2011 inclusive and a gain of 0.4212 was obtained. That is, the price of EURUSD is generally subject to trends, sometimes more, sometimes less.
We will conduct a technical analysis, so we will study the form of price movement: bends, inclinations in one direction or another, under this or that angle. You can attract a variety of different indicators, but in this case we use the Open price chain.
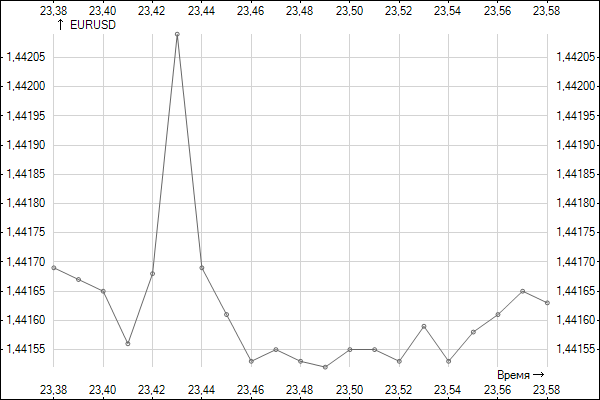
For example, let's take the current date of January 4, 2010 and the time is 23:58. At this time, the opening price was 1.44163. And in the previous minute, the price was 1.44165, that is, the price changed by -2 points. A minute earlier, the price was 1.44161, that is, the price has changed by +4 points. The result is a chain: -2, +4, +3, +5, -6, +6, -2, +0, + 3 ... Chains, if necessary, can be made long.
Similarly, you can perform a fundamental analysis. To do this, we build chains of information coming from the news feed. Obviously, for carrying out fundamental analysis requires significant computational resources and more complex methods of constructing chains, therefore, we are still not engaged in fundamental analysis.
The resulting chains are taken for the quality characteristics of the price. Next, we count them. In memory, we search for a longer chain that is observed at a given time. If nothing is found in the memory, we consider a chain of length 1 (in this case: -1).
On the found chain we remember the final result (the price goes up, the price goes down, not determined). If a certain result is obtained through this chain, that is, the price always goes up or the price always goes down or is not always determined, then leave it so. Otherwise, we extend the chain by one and remember the current result for it.
As a result, we obtain a database in which its behavior is known from the price configuration.
To assess the effectiveness of using the resulting database when trading. If there is a certain result in the current chain in memory, then we put on it. As a result, in 2010–2011, a gain of 0.4281 was obtained, which is better than the rough analysis result by 0.0031 and better than the random price gain of 0.0328.
The improvement is not very noticeable compared with the result of a rough analysis. This can be explained by the fact that a relatively small range of price movement is chosen - 200 pips, and the strategy resembles a “pipsing”. On the other hand, this suggests that the chain building method may not be sufficiently effective and must be changed. In the meantime, we will be satisfied with the fact that throughout the entire testing period the improvement in the result has been observed steadily.
When testing on wider price movements, the expert shows more interesting results. Even positive profitability is often demonstrated.
However, at the stage of building chains, the effectiveness is not ensured, only the study of price behavior is carried out.
It is not excluded that in one minute we have a buy signal, and the next - for sale. Provided that the price has not changed much - what to believe?
 Problem from the field of game theory. We are trying to understand which of the signals are correct and which are distracting or even false. As a result, it is necessary to outplay opponents, in this case, other participants in the FOREX market.
We agree on the same principle: we build chains of the last signals, we take into account price changes, we collect statistics on winning.
When testing for 2010-2011, a gain of 0.4293 was obtained, which is better than a simple analysis of the price of 0.0012.
The increase in winning is almost negligible. From time to time a very bad result was observed, it was much worse not only the result of a rough estimate, but also a result at a completely random price, that is, less than 0.3953. Sometimes even the result was about 0.3. But sometimes very successful periods were observed when the result, with such a high commission, was even at the level of 0.5. Hence the conclusion - sometimes the expert beats the market, and sometimes the market beats the expert.
When testing on wider price movements, the final result may be even worse. Obviously, with this come into effect more complex combinations that take speculative money. But the picture is the same - at times there is a significant gain, and at times - a significant loss.
Obviously, the algorithm chosen for solving the problem is imperfect, but sometimes it allows improving the result.
Further, in order to achieve maximum gain, it is necessary to select the best signals. This task is the next stage.
Selection of signals has not yet been implemented, but there is an idea of the direction in which to move. It is necessary to calculate the expectation of winning and to choose those chains whose expectation of winning gives hope for the maximum result. To do this, we collect information on all the encountered chains, and we exclude those of them, whose advantage is below a certain threshold.
An attempt was made to produce simple screenings. A certain parameter is calculated, and if it is less (or more) than the average value, the signal is eliminated. In some cases, it was possible to get a consistently winning strategy. But not enough has been done to talk about the maximum result.
Observations have shown that the identification of obviously unfavorable conditions is quite possible. Often the strategy forced the expert to be passive when there was a large loss ratio.
Sometimes it happens that a wrong decision was made earlier and this became known later. If there is still time to correct the situation, then it is necessary to take advantage of this, for example, to close a position before the losses become too great.
At this stage, we collect statistics on emerging crisis situations and avoid them in advance.
To demonstrate the effectiveness of the method, I will try to suggest a strategy with a positive expectation of winning. Take the following parameter values:
MinProfit - 300 pips
MaxLoss - 2700 pips
FeedbackHours - 24 * 7 * 4 hours
Spread - 30 pips
Due to the fact that in 2007 the result was too often not formed in 4 weeks (the price fluctuated less than 600 pips in the corridor for a long time), 2007 was calculated on the basis of FeedbackHours - 24 * 7 * 8 hours.
rough estimation
With such a strategy, a gain can be obtained only when the price moves horizontally and moves with a span of predominantly more than 600 pips, but less than 5400 pips. From the results it can be seen that the predominantly horizontal price movement was observed only in the post-crisis 2009.
Price analysis
Price analysis gives an idea of the behavior. If the behavior does not change with time, then the strategy will be winning. From the results it can be seen that until 2008, inclusive, price behavior changes almost constantly, which means that strategies based on repeatability movements led to a loss.
Perhaps this was the cause of the 2008 crisis, when financial institutions suffered huge losses and when several of the largest banks went bankrupt. Beginning in 2009, predictability appeared in the price movement, which tends to grow over time. This may be due to the fact that the scale of stimulating the economy at this time is also growing.
Signal matching
Doing signal matching, we are trying to replay other market participants. The attempt is successful and manages to reach a positive profitability by the results of 12 years. In the post-crisis years, there has also been a steady positive profitability.
Signal selection
As mentioned above, the signal selection algorithm was not implemented, but simple screenings were implemented, in which those situations that were less common than usual were eliminated. This allowed to improve the result, but according to the results of several years, after all, losses were observed. Especially high unprofitability was observed in the pre-crisis 2007.
Demonstrate even better results possible. To do this, you can try, for example, to take a minimum profit of 200 pips and a maximum loss of 1800 pips, but more research is needed to find the optimal strategy. If, however, to carry out crisis management, you can try to reduce losses by increasing total income.
It should also be taken into account that in this assessment work, the calculation of many characteristics important for a trader, such as a drawdown, was not perfected. Nevertheless, a positive expectation of profit is noticeable.
The EURUSD price movement in the FOREX market is not accidental and its behavior, in most cases, has a tendency. This indicates its predictability.
The method of building chains allows you to improve the result, but in the described form is imperfect. But, despite the imperfections, chains allow you to create strategies with a positive expectation of profit.
Obviously, the search for causal relationships by statistical methods is justified, but its widespread use will lead to far-reaching consequences. It will be possible not only to identify and level trends in a timely manner, but also to shape them.
In constructing the chains, the methodology described in the article “Automatic analysis of texts without moderators” and in comments to it was used. After the description of the algorithm, a strategy with a positive expectation of profit will be proposed.
Introduction
When processing events, one has to look for a meaning. If the sun shines from the sky and the southwest wind blows, what does this mean? And if deaf peals suddenly became dark and audible, then how does this threaten?
The answer to these questions lies in the future. If the weather is good now, then you can go for a walk. And if the clouds suddenly thickened, then it is necessary to prepare for the rain. Thus, events from the present become prerequisites for shaping the future.
')
But the future does not exist. Even if it is predetermined, a factor that can change the result to some degree or other can always appear. You can only talk about a certain probability with which the forecast is executed.
When forecasting it is necessary to operate with a limited set of information. The more of it, the more time is spent on processing. The need for processing deliberately makes instant reaction impossible. Even if the processing takes seconds, but in a second much that can happen. And the more complicated the methods involved, the greater the gap between the appearance of the initial data and the end result.
Another factor is that the behavior of the environment is not always determined and determined. This forces us to resort to empirical methods of research: first we fix the prerequisites, and then associate them with the consequences that have occurred. The time between cause and effect gives an additional delay.
If the behavior of the environment does not depend on its past states, then its prediction is impossible - you never know what will happen in the next moment. But in practice, stable cause-and-effect relationships still occur and sometimes exist from time immemorial.
Thus, the task is reduced to the collection of necessary information, an empirical search for stable causal relationships and the use of results in forecasting.
Formulation of the problem
Let us try to predict the direction of movement of the EURUSD rate on the FOREX market. We take the story in the form of one-minute bars and try to predict: will the price go up, or will the price go down? If there is no certainty in either, then we give an indefinite answer. The obtained answers are then compared with the real result and we find out if the prediction was correct or not.
The MetaTrader 4 or 5 Strategy Tester is suitable as a platform for implementation. The fifth version is more preferable, as it supports Object-Oriented Programming, but it is quite possible to get by with the fourth one.
Those who are familiar with the FOREX market and have dealt with Mechanical Trading Systems advisers are well aware of what is at stake. The tester consistently goes through history, creating trading conditions that are close to reality and gives an assessment of the effectiveness of the adviser.
When solving a problem, I implemented my tester in Java, which turned out to be justified for me.
Next, we implement the chain construction algorithm and use it for prediction.
As a result, it is necessary to conclude: is it possible to forecast in the FOREX market and is the chain building method justified?
Strategy testing
When testing, we determine the number of pips of the minimum income (MinProfit), maximum loss (MaxLoss) and set the amount of time for which we want to see the result (FeedbackHours). The last parameter is the delay between the appearance of the original data and their use in forecasting. To get closer to real conditions, we also take into account the spread (Spread).
The parameters can be varied in a wide range, MinProfit and MaxLoss can be taken different from each other. When solving the task, the following parameter values were chosen:
MinProfit - 200 pips
MaxLoss - 200 pips
FeedbackHours - 24 * 7 hours
Spread - 30 pips
The MinProfit and MaxLoss parameters are not taken too long, so that the testing time is not too long. With such parameters, the strategy will resemble pipsing. Getting a steady income from pipsing is the dream of almost all traders. Let's try to help them.
The FeedbackHours parameter is chosen not too small, since with a smaller value, the result does not always have time to form. If we consider that the goal is to search for long-term trends, then we can take large values without serious consequences. However, by reducing the waiting time for a result, you can gain an advantage in time.
Spread sets a commission for each operation. The traditional value was chosen, which is quite acceptable for solving the set task. If desired, it can be taken even zero.
When testing, the one-minute story for 2010-2011 was taken from the servers of InstaTrader and MetaQuotes. It was technically difficult for me to do testing over a wider range (more than two years).
Interpretation of results
The accepted values set the probability of winning if the price moves randomly at the level of 17/43 (approximately 0.3953).
If the expert's advantage is close to this value, then we can say that the efficiency of the method is zero. Such a result will indirectly indicate that, within the parameters adopted, the behavior of the EURUSD price on the FOREX market is completely random. To change the situation it is necessary to change the parameters.
If the result obtained is less than this value, then the method should be oriented precisely to the contrary. That is, if the result is “Buy”, then you need to sell, if you get “Sell”, then you need to buy.
If the result is greater than 17/43, then we can say that the method is effective and its development can bring results.
But even if the probability of winning is more than 0.5, it will be a mistake to assume that the so-called “grail” has been found. The profitable method will spread very quickly and its advantages will be very quickly exhausted ( 1 , 2 ).
This, in fact, is the ultimate goal of this work. If statistical methods no longer justify themselves, then every opportunity for speculation will disappear.
rough estimation
First made a rough estimate. That is, at every step the expert says “Buy” and “Sell” at the same time. The resulting gain gives information about trends in price behavior. If the winning is close to 0.3953, then we can say that there is no certainty. If it is more than 0.3953, then the price movement is subject to trends, if less, the movement is horizontal.
Moreover, if the deviation in one direction or another is large enough, then strategies will be justified in which MinProfit is not equal to MaxLoss.
Practical research has shown that in 2010–2011, a gain of 0.4250 was obtained, which is better than a gain at a random price of 0.0297. The increase in the gain is quite noticeable, and it was observed throughout the testing time.
Hereinafter, the standard deviation value is not given, since it was not calculated. For all the importance of this parameter, in this evaluation work it was ignored.
A rough estimate was also carried out for the period from 2000 to 2011 inclusive and a gain of 0.4212 was obtained. That is, the price of EURUSD is generally subject to trends, sometimes more, sometimes less.
Price analysis
We will conduct a technical analysis, so we will study the form of price movement: bends, inclinations in one direction or another, under this or that angle. You can attract a variety of different indicators, but in this case we use the Open price chain.
For example, let's take the current date of January 4, 2010 and the time is 23:58. At this time, the opening price was 1.44163. And in the previous minute, the price was 1.44165, that is, the price changed by -2 points. A minute earlier, the price was 1.44161, that is, the price has changed by +4 points. The result is a chain: -2, +4, +3, +5, -6, +6, -2, +0, + 3 ... Chains, if necessary, can be made long.
Similarly, you can perform a fundamental analysis. To do this, we build chains of information coming from the news feed. Obviously, for carrying out fundamental analysis requires significant computational resources and more complex methods of constructing chains, therefore, we are still not engaged in fundamental analysis.
The resulting chains are taken for the quality characteristics of the price. Next, we count them. In memory, we search for a longer chain that is observed at a given time. If nothing is found in the memory, we consider a chain of length 1 (in this case: -1).
On the found chain we remember the final result (the price goes up, the price goes down, not determined). If a certain result is obtained through this chain, that is, the price always goes up or the price always goes down or is not always determined, then leave it so. Otherwise, we extend the chain by one and remember the current result for it.
As a result, we obtain a database in which its behavior is known from the price configuration.
To assess the effectiveness of using the resulting database when trading. If there is a certain result in the current chain in memory, then we put on it. As a result, in 2010–2011, a gain of 0.4281 was obtained, which is better than the rough analysis result by 0.0031 and better than the random price gain of 0.0328.
The improvement is not very noticeable compared with the result of a rough analysis. This can be explained by the fact that a relatively small range of price movement is chosen - 200 pips, and the strategy resembles a “pipsing”. On the other hand, this suggests that the chain building method may not be sufficiently effective and must be changed. In the meantime, we will be satisfied with the fact that throughout the entire testing period the improvement in the result has been observed steadily.
When testing on wider price movements, the expert shows more interesting results. Even positive profitability is often demonstrated.
However, at the stage of building chains, the effectiveness is not ensured, only the study of price behavior is carried out.
Signal matching
It is not excluded that in one minute we have a buy signal, and the next - for sale. Provided that the price has not changed much - what to believe?
Problem from the field of game theory. We are trying to understand which of the signals are correct and which are distracting or even false. As a result, it is necessary to outplay opponents, in this case, other participants in the FOREX market.We agree on the same principle: we build chains of the last signals, we take into account price changes, we collect statistics on winning.
When testing for 2010-2011, a gain of 0.4293 was obtained, which is better than a simple analysis of the price of 0.0012.
The increase in winning is almost negligible. From time to time a very bad result was observed, it was much worse not only the result of a rough estimate, but also a result at a completely random price, that is, less than 0.3953. Sometimes even the result was about 0.3. But sometimes very successful periods were observed when the result, with such a high commission, was even at the level of 0.5. Hence the conclusion - sometimes the expert beats the market, and sometimes the market beats the expert.
When testing on wider price movements, the final result may be even worse. Obviously, with this come into effect more complex combinations that take speculative money. But the picture is the same - at times there is a significant gain, and at times - a significant loss.
Obviously, the algorithm chosen for solving the problem is imperfect, but sometimes it allows improving the result.
Further, in order to achieve maximum gain, it is necessary to select the best signals. This task is the next stage.
Signal selection
Selection of signals has not yet been implemented, but there is an idea of the direction in which to move. It is necessary to calculate the expectation of winning and to choose those chains whose expectation of winning gives hope for the maximum result. To do this, we collect information on all the encountered chains, and we exclude those of them, whose advantage is below a certain threshold.
An attempt was made to produce simple screenings. A certain parameter is calculated, and if it is less (or more) than the average value, the signal is eliminated. In some cases, it was possible to get a consistently winning strategy. But not enough has been done to talk about the maximum result.
Observations have shown that the identification of obviously unfavorable conditions is quite possible. Often the strategy forced the expert to be passive when there was a large loss ratio.
Crisis management
Sometimes it happens that a wrong decision was made earlier and this became known later. If there is still time to correct the situation, then it is necessary to take advantage of this, for example, to close a position before the losses become too great.
Conducting prophylaxis
At this stage, we collect statistics on emerging crisis situations and avoid them in advance.
An example of a profitable strategy
To demonstrate the effectiveness of the method, I will try to suggest a strategy with a positive expectation of winning. Take the following parameter values:
MinProfit - 300 pips
MaxLoss - 2700 pips
FeedbackHours - 24 * 7 * 4 hours
Spread - 30 pips
Due to the fact that in 2007 the result was too often not formed in 4 weeks (the price fluctuated less than 600 pips in the corridor for a long time), 2007 was calculated on the basis of FeedbackHours - 24 * 7 * 8 hours.
rough estimation
With such a strategy, a gain can be obtained only when the price moves horizontally and moves with a span of predominantly more than 600 pips, but less than 5400 pips. From the results it can be seen that the predominantly horizontal price movement was observed only in the post-crisis 2009.
Price analysis
Price analysis gives an idea of the behavior. If the behavior does not change with time, then the strategy will be winning. From the results it can be seen that until 2008, inclusive, price behavior changes almost constantly, which means that strategies based on repeatability movements led to a loss.
Perhaps this was the cause of the 2008 crisis, when financial institutions suffered huge losses and when several of the largest banks went bankrupt. Beginning in 2009, predictability appeared in the price movement, which tends to grow over time. This may be due to the fact that the scale of stimulating the economy at this time is also growing.
Signal matching
Doing signal matching, we are trying to replay other market participants. The attempt is successful and manages to reach a positive profitability by the results of 12 years. In the post-crisis years, there has also been a steady positive profitability.
Signal selection
As mentioned above, the signal selection algorithm was not implemented, but simple screenings were implemented, in which those situations that were less common than usual were eliminated. This allowed to improve the result, but according to the results of several years, after all, losses were observed. Especially high unprofitability was observed in the pre-crisis 2007.
Demonstrate even better results possible. To do this, you can try, for example, to take a minimum profit of 200 pips and a maximum loss of 1800 pips, but more research is needed to find the optimal strategy. If, however, to carry out crisis management, you can try to reduce losses by increasing total income.
It should also be taken into account that in this assessment work, the calculation of many characteristics important for a trader, such as a drawdown, was not perfected. Nevertheless, a positive expectation of profit is noticeable.
findings
The EURUSD price movement in the FOREX market is not accidental and its behavior, in most cases, has a tendency. This indicates its predictability.
The method of building chains allows you to improve the result, but in the described form is imperfect. But, despite the imperfections, chains allow you to create strategies with a positive expectation of profit.
Obviously, the search for causal relationships by statistical methods is justified, but its widespread use will lead to far-reaching consequences. It will be possible not only to identify and level trends in a timely manner, but also to shape them.
Source: https://habr.com/ru/post/143539/
All Articles