Zabbix, we monitor MongoDB
Good time of day!
... the customer requested MongoDB monitoring. Having rummaged through the Internet, I came across an article about the MongoDB (MMS) online monitoring system, but this option does not quite fit because: firstly, these statistics should not go further than their servers, secondly, the company raised an excellent in my opinion Zabbix monitoring system . On the website of MobgoDB in the monitoring and diagnostics section there was a mention for the ready-made Zabbix plugin from Mikoomi "MongoDB Plugin" . It was decided to use it. Judging by the comments, he earned it from one person and there really were some difficulties in the process. About the mistakes that I saw wrote to the developer, but he did not respond to one letter.
The following inaccuracies were noticed:
- incorrect calculation of the number of databases (error in php file)
- in the description of the template, the parameters for retrieving the statistics of the log files were, but in reality they are not (an error in the template)
')
- triggers did not work (also an error in the template)
Everything is fixed, working and tested.
So, what we have:
Debian squeeze
Zabbix 1.8.10
Mongodb-10gen
I will not consider the installation of the OS (operating system), the CM (monitoring system) and the DBMS (database management system) MongoDB as it is beyond the scope of this article. Documentation on the installation and configuration is more than enough.
So, go ahead.
The entire installation takes place only on servers with Zabbix SM. On the MongoDB server, you only need to open port 27017.
For the operation of the plugin, install zabbix-agen t, which includes the zabbix sender we need .
Create a directory for ExternalScripts - placing external scripts:
We show Zabbiks where his external scripts live, for this we look for where we have the section “ExternalScripts” and fix it to the following view (we rule one line):
The MongoDB plugin itself works with the MongoDB PHP driver that you need to install. The following packages will be needed for this:
Now directly installing the MongoDB PHP driver itself:
After successful installation, you must enable it. In php.ini we look for the section " Dynamic Extensions" and add one line there.
In our cases we add to both found files:
After editing, so that the changes would take effect restarting the web server:
We test the driver , for this we will create a file with such contents
run the test script
If everything works, the result should be:
It was
has become
We download the plugin itself ( shell and php scripts) and copy the files to the desired folder.
Making both executable
we set the owner
restarting zabbix server
Download the template for Zabbix from Miookomi . And already from the web interface of the CM we import the template
We connect MongoDB server to CM
In the macros section, add three macros (if the connection to the database without authorization)
If the connection is authorized then plus two more macros
And in the end, do not forget to “Save”.
It should look something like this:
Checking the work of the plugin
if everything is OK, the log file should be
Delete the log file and the file with the data not created by the user zabbix
We are waiting for a minute and the logs will appear again, if the above is there, then it all worked. Go to the “Monitoring” web interface - “Latest data” and admire the result :)
The default pattern is with:
13 groups (which includes 77 data elements)
14 triggers
4 groups of graphs
"Counting operations in the last minute"
"Using the Journal"
... the customer requested MongoDB monitoring. Having rummaged through the Internet, I came across an article about the MongoDB (MMS) online monitoring system, but this option does not quite fit because: firstly, these statistics should not go further than their servers, secondly, the company raised an excellent in my opinion Zabbix monitoring system . On the website of MobgoDB in the monitoring and diagnostics section there was a mention for the ready-made Zabbix plugin from Mikoomi "MongoDB Plugin" . It was decided to use it. Judging by the comments, he earned it from one person and there really were some difficulties in the process. About the mistakes that I saw wrote to the developer, but he did not respond to one letter.
The following inaccuracies were noticed:
- incorrect calculation of the number of databases (error in php file)
- in the description of the template, the parameters for retrieving the statistics of the log files were, but in reality they are not (an error in the template)
')
Journaling: Commits in last 1 Minute Journaling: Commits in Writelocks in last 1 Minute Journaling: Datafile Write Time (ms) in last 1 Minute Journaling: Datafile Writes (MB) in last 1 Minute Journaling: Early Commits in last 1 Minute Journaling: Journal Write Time (ms) in last 1 Minute Journaling: Journal Writes (MB) in last 1 Minute Journaling: Log Buffer Prep Time (ms) in last 1 Minute - triggers did not work (also an error in the template)
One or more databases have been created One or more databases have been destroyed One or more replication members need attention One or more members have been removed from the ReplicaSet One or more members have been added to the ReplicaSet One or more new shard chunks have been created One or more shards have been added to the cluster One or more shards have been removed from the cluster One or more new sharded collections have been created One or more collections have been dropped One or more collections have been added One or more indexes have been dropped One or more indexes have been added Everything is fixed, working and tested.
So, what we have:
Debian squeeze
Zabbix 1.8.10
Mongodb-10gen
I will not consider the installation of the OS (operating system), the CM (monitoring system) and the DBMS (database management system) MongoDB as it is beyond the scope of this article. Documentation on the installation and configuration is more than enough.
So, go ahead.
The entire installation takes place only on servers with Zabbix SM. On the MongoDB server, you only need to open port 27017.
For the operation of the plugin, install zabbix-agen t, which includes the zabbix sender we need .
sudo apt-get install zabbix-agent Create a directory for ExternalScripts - placing external scripts:
sudo mkdir -p /etc/zabbix/externalscripts/ We show Zabbiks where his external scripts live, for this we look for where we have the section “ExternalScripts” and fix it to the following view (we rule one line):
sudo nano /etc/zabbix/zabbix_server.conf ### Option: ExternalScripts # Location of external scripts # Mandatory: no # Default: ExternalScripts=/etc/zabbix/externalscripts The MongoDB plugin itself works with the MongoDB PHP driver that you need to install. The following packages will be needed for this:
sudo apt-get install php5-dev php-pear gcc make git Now directly installing the MongoDB PHP driver itself:
sudo pecl install mongo After successful installation, you must enable it. In php.ini we look for the section " Dynamic Extensions" and add one line there.
sudo find /etc/ -name "php.ini" /etc/php5/apache2/php.ini /etc/php5/cli/php.ini In our cases we add to both found files:
;;;;;;;;;;;;;;;;;;;;;; ; Dynamic Extensions ; ;;;;;;;;;;;;;;;;;;;;;; extension=mongo.so After editing, so that the changes would take effect restarting the web server:
sudo apache2ctl -k graceful We test the driver , for this we will create a file with such contents
nano ~/test.php <?php // connect $m = new Mongo(); // select a database $db = $m->comedy; // select a collection (analogous to a relational database's table) $collection = $db->cartoons; // add a record $obj = array( "title" => "Calvin and Hobbes", "author" => "Bill Watterson" ); $collection->insert($obj); // add another record, with a different "shape" $obj = array( "title" => "XKCD", "online" => true ); $collection->insert($obj); // find everything in the collection $cursor = $collection->find(); // iterate through the results foreach ($cursor as $obj) { echo $obj["title"] . "\n"; } ?> run the test script
/usr/bin/php5 test.php If everything works, the result should be:
Calvin and Hobbes XKCD The note:
if the database is not on localhost, then in the test script the connection string will be:It was
$m = new Mongo(); has become
$m = new Mongo( "example.com:27017" ); We download the plugin itself ( shell and php scripts) and copy the files to the desired folder.
sudo cd ~ && git clone git://gist.github.com/2634051.git gist-2634051 && cp ~/gist-2634051/mikoomi-mongodb-plugin.* /etc/zabbix/externalscripts/ Making both executable
sudo chmod 755 /etc/zabbix/externalscripts/mikoomi-mongodb-plugin.* we set the owner
sudo chown -R zabbix:zabbix /etc/zabbix/externalscripts/ restarting zabbix server
sudo /etc/init.d/zabbix-server restart Download the template for Zabbix from Miookomi . And already from the web interface of the CM we import the template
- Settings-Templates
- Click the “Import Template” button in the upper right corner.
- Find previously downloaded template.
- Load the template.
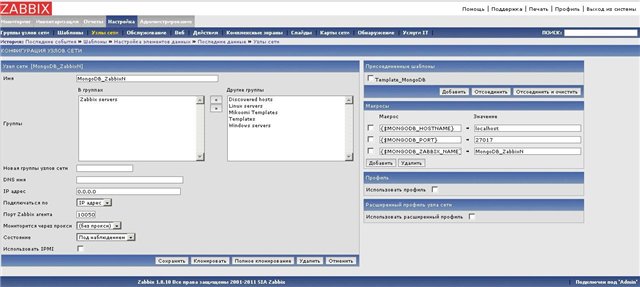
We connect MongoDB server to CM
- * Setup - Network nodes
- * Click on the button in the upper right corner “Create a host”
- * Fill in the required parameters
- * Click the “Add” button and specify “Template_MongoDB”
In the macros section, add three macros (if the connection to the database without authorization)
{$MONGODB_HOSTNAME} = IP {$MONGODB_PORT} = , 27017 {$MONGODB_ZABBIX_NAME} = () If the connection is authorized then plus two more macros
{$MONGODB_USER} = {$MONGODB_PASS} = And in the end, do not forget to “Save”.
It should look something like this:
Checking the work of the plugin
cd /etc/zabbix/externalscripts/ ./mikoomi-mongodb-plugin.sh [-D -h 127.0.0.1 -p 27017 -z MongoDB_ZabbixN ] if everything is OK, the log file should be
tail -f /tmp/mikoomi-mongodb-plugin.php_MongoDB_ZabbixN.log "response":"success", "info":"Processed 66 Failed 5 Total 71 Seconds spent 0.000747"}] Info from server: "Processed 66 Failed 5 Total 71 Seconds spent 0.000747" sent: 71; skipped: 2; total: 73 Delete the log file and the file with the data not created by the user zabbix
rm -rf /tmp/mikoomi-mongodb-plugin.php_MongoDB_ZabbixN.* We are waiting for a minute and the logs will appear again, if the above is there, then it all worked. Go to the “Monitoring” web interface - “Latest data” and admire the result :)
The default pattern is with:
13 groups (which includes 77 data elements)
14 triggers
4 groups of graphs
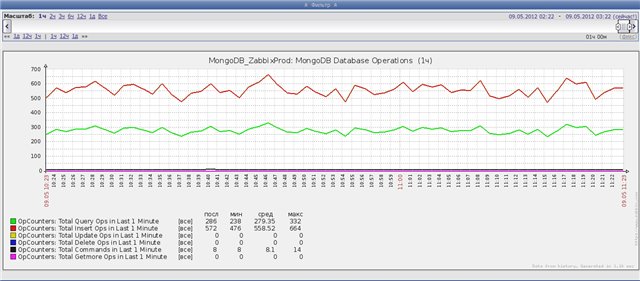
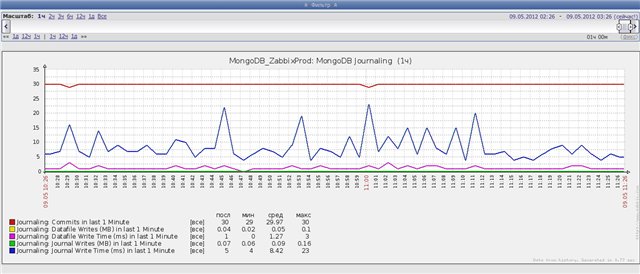
Examples of graphs
"Counting operations in the last minute"
"Using the Journal"
Source: https://habr.com/ru/post/143498/
All Articles