How to improve site performance or 5 reasons to start using Google Analytics
One of the most popular questions that I regularly hear from potential customers pushed me to writing this article: how will my business be helped by implementing a web analysis system that you advise us to use? Heads of companies, directors and marketing and advertising managers, who in Russia, for the most part, unfortunately, have a rather low understanding of web marketing principles, want to see real examples of how the introduction of systems like Google Analytics and Yandex Metric can help their business . Typically, customers have a basic understanding of the capabilities of such systems and use their capabilities to a minimum: monitor the attendance of their sites, know where visitors come from, have a general idea of the failure rate, and approximately know the conversion value on their sites. If you, dear readers, think that this is enough to measure the effectiveness of your website and advertising campaigns (be it contextual advertising, SEO or any other way of attracting visitors to your website), it means that your competitors who actively use statistics systems , or you have already overtaken, or soon overtake.
Below, I tried to give five, in my opinion, serious reasons why you just need to not only fully implement and configure the web analysis system on your website, but also to learn yourself and teach your employees to actively use it (using Google Analytics as an example).
1. By what channels do your clients come to your site?
')
What do you, as a person interested in increasing the profitability of your company, give this information? Knowing the channels through which visitors to your site come to you, who then become your clients, you will be able to more effectively distribute the advertising budget, namely, invest more in those channels for which the ratio of clients and visitors is maximum. Thus, investing in more “conversion” channels to attract visitors and reducing budgets for the rest, you will increase the overall conversion on the site, and, therefore, your sales will increase.
Hereinafter, we need to understand that when it comes to the growth of conversion and direct sales of the company, then Internet shops are not necessarily meant. Conversion is not only the ratio of the number of end customers and the number of visitors to the online store. Conversion - is the ratio of visitors who committed the target action on the site to all visitors to the site. This may be the ratio of the number of applications left for a loan on the site and the number of visitors for the bank’s site or the ratio of the number of entries to a seminar through the form and the number of visitors for the training portal. It is important to correctly and clearly define the goals of your site, set up tracking in the web analysis system and make sure that visitors have no difficulty in achieving your specific goals (that is, the interface of your site does not impede this, but rather contributes)
Let's return to the discussion of Google Analytics web analytics capabilities.
How to find out which channels of attracting visitors for your site are of the highest quality (i.e., channels for which the conversion of visitors into targeted actions is maximum)? To do this in Google Analytics in the menu on the left, select:
“Traffic Sources” -> “Sources” -> “All Traffic”.
You will see a list of channels in front of you, with standard indicators - the number of visits for each channel, the bounce rate and others:
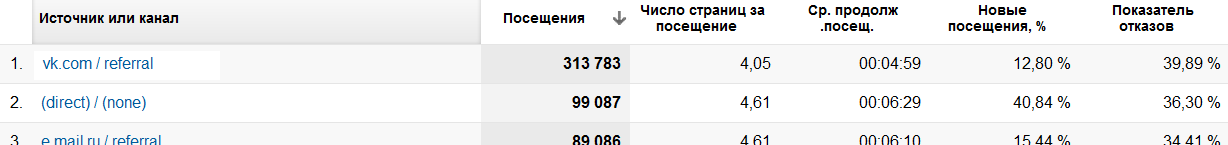
On the same page, above, next to the link "Use of the site", which is selected by default when you go to this page, there are links that read: "Set goals 1", "Set goals 2" and so on, depending on How many goals are configured in your Google Analytics account:

We choose one of the sets of goals (there can be no more than four in total, each set can contain no more than 5 goals, that is, the maximum number of site goals configured in Google Analytics is 20) and we see that in the table with traffic channels the standard indicators were replaced with indicators conversions for each source:
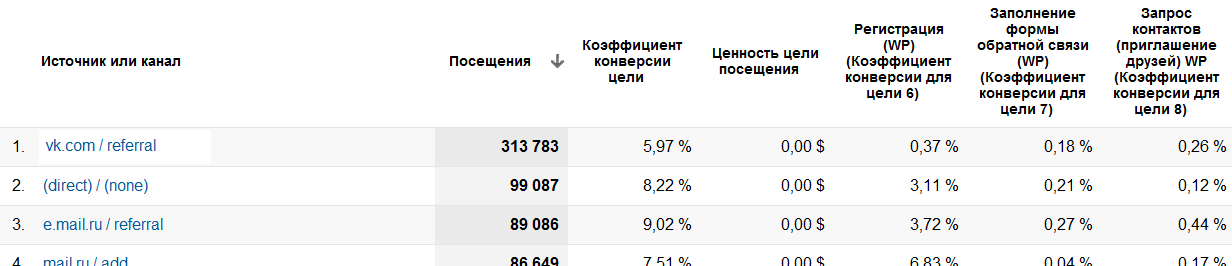
Then we do the following: we sort the table in descending order of conversion by one of the goals - for this we click on the name of the goal, in this example “Registration (WP)”:
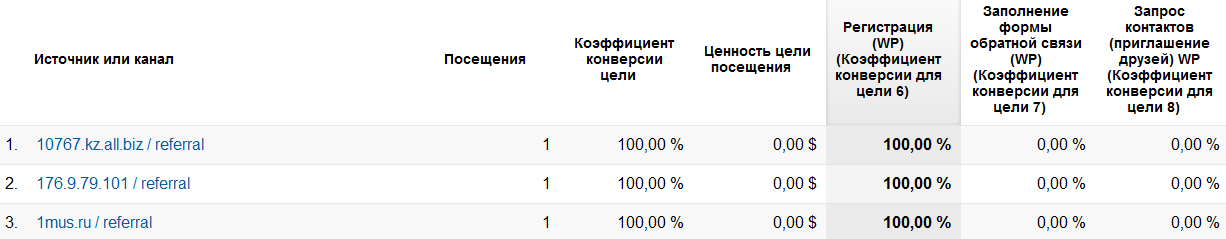
We get a table in which at the top of the list there are sources with a ratio of the number of registrations and the number of visits - 1: 1 (1 registration, 1 visit), which naturally does not answer the question posed about the most high-quality channels, since the amount of data for which conversion is calculated, extremely small.
A little above the table there is a field for choosing “Sort type”.

Select the sort type “Weighted” and get a list of channels to attract visitors, weighed sorted by the number of visits and registrations:
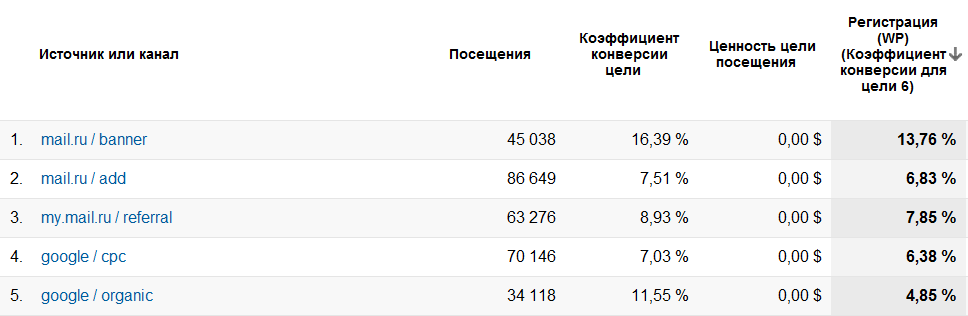
From the data above it is clear that banner advertising on mail.ru for this site is effective and visitors who click on a banner are actively registered on the site, which means it makes sense to continue using this advertising channel (of course, all other things being equal, for example, placement costs advertising).
2. Which advertising channels bring you the largest number of customers?
Now consider a less trivial way to study the effectiveness of your advertising. Suppose you are considering whether you should actively begin using SMM (Social Media Marketing) as one of the ways to attract visitors to the site. Obviously, if your company is an online store of amazing things or a shop selling high-tech equipment for airplanes, then most likely, people from social networks will treat the representation of your business on blogs and social networks differently. But to rely not on “most likely”, but on facts and statistics, we need the Google Analytics “Extended Segments” tool to determine the average conversion across all “social” channels at once.
In order to create a new extended segment, click on the "Extended Segments" button at the top of the page and select "add segment":

Further, we need to add the main “social” resources to our new segment and somehow name it (we called it “social traffic”):

That is, in fact, from all visitors to the site, we single out all those who came to the site by links from blogs and social networks (that is, we create a separate segment of visitors - “social traffic”)
Then, click the button “Save segment” (or “Test” if you are not sure of the entered data) and we get the following interesting data:

As we can see, transitions from social networks and blogs make up for this website 5.29% of all visits. The conversion rate for the “registration” goal is 3.39%. This figure is lower than the conversion of banner advertising on mail.ru, and the conversion of contextual advertising Google Adwords, and the conversion of conversions from free Google search. In this case (and with other things being equal, for example, the budgets of each channel) investing in SMM is not profitable.
3. Where do your customers live?
Sometimes it is important to know where your website visitors live, which more often than others become your customers. This information is important to consider, for example, when choosing cities to display contextual ads in the respective systems. To do this, in the navigation menu on the left, select:
“Audience” -> “Demography” -> “Location”
We see the statistics of transitions to your site in the context of countries. To get statistics on the transitions to your site by city, for example, “Russia”, simply click on the list of countries in Russia. To now find out from which region the visitors are best converted, we use the technique described in paragraph 1: select one of the predefined sets of goals (also next to the selection of a set of goals, select the Research tab) and weightedly sort the table according to one of the goals and the number visits:

As we can see, visitors from Moscow and St. Petersburg are best converted for this site, which must be taken into account, for example, when allocating budgets for campaigns for contextual advertising (that is, the campaign budget for Moscow and St. Petersburg should be Higher than on the campaigns of other cities of Russia).
4. What are your potential customers looking for on your site?
Many site owners and webmasters know that with the help of Google Analytics you can find out which queries your visitors use in search engines. However, few know how to get information about what visitors are looking for directly on your site.
The process of setting up tracking of an internal site search is not complicated: you need to go to your own website, type something in the search bar and then look at the URL of the page that is formed after the search is executed. For example, if your site is called example.com, and you typed “123” in the search bar on the site, the URL formed as a result of the search may look like this:
example.com/?s=123
When you received a similar URL for your site, you need to click on the "Administrator" button in the upper right corner of Google Analytics, then select "Profile Settings". Under the heading “Site Search Settings”, select “Track Site Search”:
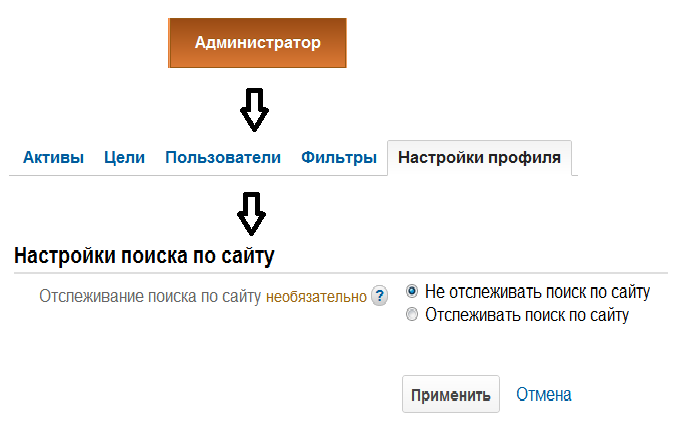
Next, you need to enter "s" as a request parameter (for example.com site - the search parameter for your site may be different).
To see the results of the setup, go to Google Analytics:
Content -> Site Search -> Overview

Why is it necessary to have information about what visitors are looking for on your site? In the case when your company is an online store, and you know what products visitors expect to find on the site (and how often they are looking for it), then you can add new product lines to the site, maximally satisfying consumer demand.
5. How do you lose almost held customers?
This part of the article will be of particular interest to readers who have a process of placing an order on the site (or filling out an application or registering on the site) consists of several steps.
As an example I will give a typical process of placing an order in an online store, which consists of several steps:
basket page -> contact and address data filling page -> filled information confirmation page -> successful order page.
Such a sequence of steps in Internet marketing is called a “conversion funnel,” and one of the ways to increase sales through the website is to optimize the conversion funnel.
You, of course, understand that the number of visitors with each step of the order is reduced: someone could just change their mind to place an order, someone could be distracted by something more interesting, someone turned off the Internet, and so on. Our task is to make sure that the maximum number of visitors who started to place an order did get to the page of a successful order. And in order to do this, you first need to analyze the possible reasons for why visitors do not go to one or another next ordering process, and try to influence it. Of course, we will not be able to influence the disconnected Internet, but it’s possible that the visitor will not be distracted by anything, and he will not leave anywhere on one of the checkout pages.
First you need to make sure that your site is configured with a "sequence of transitions to the goal." To do this, click on the "Administrator" button and select the "Goals" section. Select one of the previously created site goals and look at the settings under the heading "Going to the goal" (in the English version of Google Analytics - Goal Funnel):
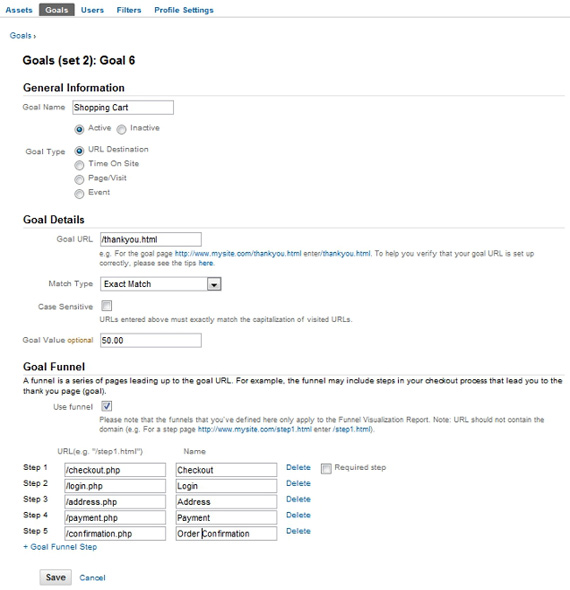
As we see in the example above, the process of placing an order in this online store consists of 5 steps.
I use the Google Analytics functionality “Sequence of Goals to the Goal”, you can get a report on the progress of the ordering process by visitors. To do this, you need to go to Google Analytics:
Conversions -> Goals -> Sequence Visualization
Where you will see the following visualization of the checkout process:
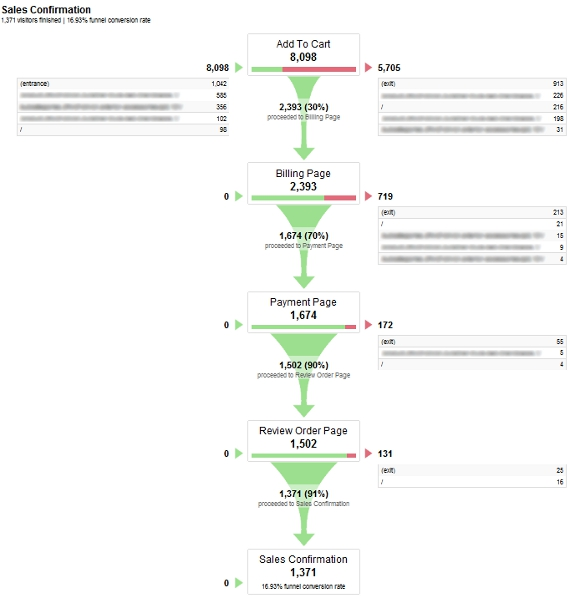
The sequence visualization tool Google Analytics allows you to visually see where visitors go from each step of the checkout process. With such information, you will be able to make changes in the interface of your website and the ordering process and will be able to seek expansion of the conversion funnel, which means an increase in sales.
findings
This article highlights some of the key features of the Google Analytics statistics and web analysis system. Having cited 5 illustrative examples, the author tried to focus precisely on the use of web analytics in achieving the organization’s business goals and to show the need to invest in installing and configuring Google Analytics and Yandex.Metrica, as well as in training its employees in web analytics.
Below, I tried to give five, in my opinion, serious reasons why you just need to not only fully implement and configure the web analysis system on your website, but also to learn yourself and teach your employees to actively use it (using Google Analytics as an example).
1. By what channels do your clients come to your site?
')
What do you, as a person interested in increasing the profitability of your company, give this information? Knowing the channels through which visitors to your site come to you, who then become your clients, you will be able to more effectively distribute the advertising budget, namely, invest more in those channels for which the ratio of clients and visitors is maximum. Thus, investing in more “conversion” channels to attract visitors and reducing budgets for the rest, you will increase the overall conversion on the site, and, therefore, your sales will increase.
Hereinafter, we need to understand that when it comes to the growth of conversion and direct sales of the company, then Internet shops are not necessarily meant. Conversion is not only the ratio of the number of end customers and the number of visitors to the online store. Conversion - is the ratio of visitors who committed the target action on the site to all visitors to the site. This may be the ratio of the number of applications left for a loan on the site and the number of visitors for the bank’s site or the ratio of the number of entries to a seminar through the form and the number of visitors for the training portal. It is important to correctly and clearly define the goals of your site, set up tracking in the web analysis system and make sure that visitors have no difficulty in achieving your specific goals (that is, the interface of your site does not impede this, but rather contributes)
Let's return to the discussion of Google Analytics web analytics capabilities.
How to find out which channels of attracting visitors for your site are of the highest quality (i.e., channels for which the conversion of visitors into targeted actions is maximum)? To do this in Google Analytics in the menu on the left, select:
“Traffic Sources” -> “Sources” -> “All Traffic”.
You will see a list of channels in front of you, with standard indicators - the number of visits for each channel, the bounce rate and others:
On the same page, above, next to the link "Use of the site", which is selected by default when you go to this page, there are links that read: "Set goals 1", "Set goals 2" and so on, depending on How many goals are configured in your Google Analytics account:
We choose one of the sets of goals (there can be no more than four in total, each set can contain no more than 5 goals, that is, the maximum number of site goals configured in Google Analytics is 20) and we see that in the table with traffic channels the standard indicators were replaced with indicators conversions for each source:
Then we do the following: we sort the table in descending order of conversion by one of the goals - for this we click on the name of the goal, in this example “Registration (WP)”:
We get a table in which at the top of the list there are sources with a ratio of the number of registrations and the number of visits - 1: 1 (1 registration, 1 visit), which naturally does not answer the question posed about the most high-quality channels, since the amount of data for which conversion is calculated, extremely small.
A little above the table there is a field for choosing “Sort type”.
Select the sort type “Weighted” and get a list of channels to attract visitors, weighed sorted by the number of visits and registrations:
From the data above it is clear that banner advertising on mail.ru for this site is effective and visitors who click on a banner are actively registered on the site, which means it makes sense to continue using this advertising channel (of course, all other things being equal, for example, placement costs advertising).
2. Which advertising channels bring you the largest number of customers?
Now consider a less trivial way to study the effectiveness of your advertising. Suppose you are considering whether you should actively begin using SMM (Social Media Marketing) as one of the ways to attract visitors to the site. Obviously, if your company is an online store of amazing things or a shop selling high-tech equipment for airplanes, then most likely, people from social networks will treat the representation of your business on blogs and social networks differently. But to rely not on “most likely”, but on facts and statistics, we need the Google Analytics “Extended Segments” tool to determine the average conversion across all “social” channels at once.
In order to create a new extended segment, click on the "Extended Segments" button at the top of the page and select "add segment":
Further, we need to add the main “social” resources to our new segment and somehow name it (we called it “social traffic”):
That is, in fact, from all visitors to the site, we single out all those who came to the site by links from blogs and social networks (that is, we create a separate segment of visitors - “social traffic”)
Then, click the button “Save segment” (or “Test” if you are not sure of the entered data) and we get the following interesting data:
As we can see, transitions from social networks and blogs make up for this website 5.29% of all visits. The conversion rate for the “registration” goal is 3.39%. This figure is lower than the conversion of banner advertising on mail.ru, and the conversion of contextual advertising Google Adwords, and the conversion of conversions from free Google search. In this case (and with other things being equal, for example, the budgets of each channel) investing in SMM is not profitable.
3. Where do your customers live?
Sometimes it is important to know where your website visitors live, which more often than others become your customers. This information is important to consider, for example, when choosing cities to display contextual ads in the respective systems. To do this, in the navigation menu on the left, select:
“Audience” -> “Demography” -> “Location”
We see the statistics of transitions to your site in the context of countries. To get statistics on the transitions to your site by city, for example, “Russia”, simply click on the list of countries in Russia. To now find out from which region the visitors are best converted, we use the technique described in paragraph 1: select one of the predefined sets of goals (also next to the selection of a set of goals, select the Research tab) and weightedly sort the table according to one of the goals and the number visits:
As we can see, visitors from Moscow and St. Petersburg are best converted for this site, which must be taken into account, for example, when allocating budgets for campaigns for contextual advertising (that is, the campaign budget for Moscow and St. Petersburg should be Higher than on the campaigns of other cities of Russia).
4. What are your potential customers looking for on your site?
Many site owners and webmasters know that with the help of Google Analytics you can find out which queries your visitors use in search engines. However, few know how to get information about what visitors are looking for directly on your site.
The process of setting up tracking of an internal site search is not complicated: you need to go to your own website, type something in the search bar and then look at the URL of the page that is formed after the search is executed. For example, if your site is called example.com, and you typed “123” in the search bar on the site, the URL formed as a result of the search may look like this:
example.com/?s=123
When you received a similar URL for your site, you need to click on the "Administrator" button in the upper right corner of Google Analytics, then select "Profile Settings". Under the heading “Site Search Settings”, select “Track Site Search”:
Next, you need to enter "s" as a request parameter (for example.com site - the search parameter for your site may be different).
To see the results of the setup, go to Google Analytics:
Content -> Site Search -> Overview
Why is it necessary to have information about what visitors are looking for on your site? In the case when your company is an online store, and you know what products visitors expect to find on the site (and how often they are looking for it), then you can add new product lines to the site, maximally satisfying consumer demand.
5. How do you lose almost held customers?
This part of the article will be of particular interest to readers who have a process of placing an order on the site (or filling out an application or registering on the site) consists of several steps.
As an example I will give a typical process of placing an order in an online store, which consists of several steps:
basket page -> contact and address data filling page -> filled information confirmation page -> successful order page.
Such a sequence of steps in Internet marketing is called a “conversion funnel,” and one of the ways to increase sales through the website is to optimize the conversion funnel.
You, of course, understand that the number of visitors with each step of the order is reduced: someone could just change their mind to place an order, someone could be distracted by something more interesting, someone turned off the Internet, and so on. Our task is to make sure that the maximum number of visitors who started to place an order did get to the page of a successful order. And in order to do this, you first need to analyze the possible reasons for why visitors do not go to one or another next ordering process, and try to influence it. Of course, we will not be able to influence the disconnected Internet, but it’s possible that the visitor will not be distracted by anything, and he will not leave anywhere on one of the checkout pages.
First you need to make sure that your site is configured with a "sequence of transitions to the goal." To do this, click on the "Administrator" button and select the "Goals" section. Select one of the previously created site goals and look at the settings under the heading "Going to the goal" (in the English version of Google Analytics - Goal Funnel):
As we see in the example above, the process of placing an order in this online store consists of 5 steps.
I use the Google Analytics functionality “Sequence of Goals to the Goal”, you can get a report on the progress of the ordering process by visitors. To do this, you need to go to Google Analytics:
Conversions -> Goals -> Sequence Visualization
Where you will see the following visualization of the checkout process:
The sequence visualization tool Google Analytics allows you to visually see where visitors go from each step of the checkout process. With such information, you will be able to make changes in the interface of your website and the ordering process and will be able to seek expansion of the conversion funnel, which means an increase in sales.
findings
This article highlights some of the key features of the Google Analytics statistics and web analysis system. Having cited 5 illustrative examples, the author tried to focus precisely on the use of web analytics in achieving the organization’s business goals and to show the need to invest in installing and configuring Google Analytics and Yandex.Metrica, as well as in training its employees in web analytics.
Source: https://habr.com/ru/post/143179/
All Articles