Using the Yandex.Map API for working with arbitrary substrates
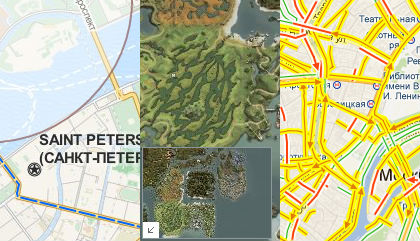
What do the three pictures have in common? On the left - the part of St. Petersburg from OpenStreetMap. On the central - a map from Lineage 2. On the right - Moscow traffic jams on a substrate from Google. And the new API Yandex.Maps, which was recently published, combines these images.
One of the features of API 2.0 is very easy to use support for arbitrary substrates. You do not need to use Yandex maps for your resource. No one bothers to cross the substrate from OpenStreetMap and the powerful API from Yandex to implement the map functionality.
')
Want to show your pizzeria delivery area on OpenStreetMap? Locate the next MMORPG monsters on the map? Display Yandex.Probki on the map from Google? Nothing is easier!
Example 1. Yandex.Probki + Google.Maps
living example
var map = new ym.Map('map', { center: [55.744, 37.587], zoom: 12, type: null // - "" . }, {}); var googleLayer = new ym.Layer('http://mt0.google.com/vt/lyrs=m@176000000&hl=ru&%c', { projection: ym.projection.sphericalMercator, // Google. tileTransparent: true }); map.layers.add(googleLayer); map.controls.add(new ym.control.TrafficControl({ shown: true }), { left: 5, top: 5 }); Let us see what we have written. First of all, it is worth paying attention to the Layer class, it is through it that new layers of the map are created. Input parameters are the pattern of the url of tiles and options. A description of the format of the template is in the documentation. In this example, of interest is the projection option, which tells the API about the projection of the layer. The fact is that the Yandex.Maps API uses the WGS 84 projection, which is slightly different from the Spherical Mercator used in OSM and Google. Therefore, when adding a layer, you need to specify its projection, otherwise, if you add a point along the coordinates of your house, then it may be visually on a third-party layer not where you expected to see it.
Example 2. OpenStreetMap + Graphics Yandex.Maps API
living example
var map = new ym.Map('map', { center: [59.947, 30.325], zoom: 13, type: null // - "" . }, {}); var osmLayer = new ym.Layer('http://otile%d.mqcdn.com/tiles/1.0.0/osm/%z/%x/%y.png', { projection: ym.projection.sphericalMercator, // OSM tileTransparent: true }); map.layers.add(osmLayer); var train = new ym.Placemark([59.928815, 30.362311], { hintContent: " " }, { preset: "twirl#trainIcon" }) map.geoObjects.add(train); var pizza = new ym.Placemark([59.954327, 30.30698], { balloonContent: "" }, { preset: "twirl#cafeIcon" }) map.geoObjects.add(pizza); var area = new ym.Circle([[59.954327, 30.30698], 1400], { hintContent: " " }, { strokeColor: "#7C444399", strokeWidth: 2, fillColor: "#FFFFFF66", hintHideTimeout: 100 }); area.events.add("mouseenter", function(e) { this.options.set({ strokeColor: "#7C4443BB", strokeWidth: 4, fillColor: "#FFFFFF99" }) }, area); area.events.add("mouseleave", function(e) { this.options.set({ strokeColor: "#7C444399", strokeWidth: 2, fillColor: "#FFFFFF66" }) }, area); var geometry = ym.geometry.LineString.fromEncodedCoordinates("-nCSA99KzwFdBwAA0v3__2kBAABk-___" + "SgYAAKHO__8bEQAAQHX__y0BAAB_____8gIAAFcBAAAREAAAXej__-EEAAAo_v__mwIAANH8__9zAwAAdfj__" + "wAJAACBAAAAbgEAAK0BAAAaAgAA2wMAAKAEAAB_____VgAAAAoHAAACAQAArAAAAHcFAAAl_P__" + "3gMAAAAAAAAyAwAA1wAAAMYCAACtAQAAcAIAAFkCAAA="); // var line = new ym.Polyline(geometry, {}, { strokeWidth: 2, strokeStyle: "longdash" }); map.geoObjects.add(line); map.geoObjects.add(area); pizza.balloon.open(); -___" + "SgYAAKHO__8bEQAAQHX__y0BAAB _____ 8gIAAFcBAAAREAAAXej __- EEAAAo_v__mwIAANH8__9zAwAAdfj__" + "wAJAACBAAAAbgEAAK0BAAAaAgAA2wMAAKAEAAB_____VgAAAAoHAAACAQAArAAAAHcFAAAl_P__" + "3gMAAAAAAAAyAwAA1wAAAMYCAACtAQAAcAIAAFkCAAA ="); var map = new ym.Map('map', { center: [59.947, 30.325], zoom: 13, type: null // - "" . }, {}); var osmLayer = new ym.Layer('http://otile%d.mqcdn.com/tiles/1.0.0/osm/%z/%x/%y.png', { projection: ym.projection.sphericalMercator, // OSM tileTransparent: true }); map.layers.add(osmLayer); var train = new ym.Placemark([59.928815, 30.362311], { hintContent: " " }, { preset: "twirl#trainIcon" }) map.geoObjects.add(train); var pizza = new ym.Placemark([59.954327, 30.30698], { balloonContent: "" }, { preset: "twirl#cafeIcon" }) map.geoObjects.add(pizza); var area = new ym.Circle([[59.954327, 30.30698], 1400], { hintContent: " " }, { strokeColor: "#7C444399", strokeWidth: 2, fillColor: "#FFFFFF66", hintHideTimeout: 100 }); area.events.add("mouseenter", function(e) { this.options.set({ strokeColor: "#7C4443BB", strokeWidth: 4, fillColor: "#FFFFFF99" }) }, area); area.events.add("mouseleave", function(e) { this.options.set({ strokeColor: "#7C444399", strokeWidth: 2, fillColor: "#FFFFFF66" }) }, area); var geometry = ym.geometry.LineString.fromEncodedCoordinates("-nCSA99KzwFdBwAA0v3__2kBAABk-___" + "SgYAAKHO__8bEQAAQHX__y0BAAB_____8gIAAFcBAAAREAAAXej__-EEAAAo_v__mwIAANH8__9zAwAAdfj__" + "wAJAACBAAAAbgEAAK0BAAAaAgAA2wMAAKAEAAB_____VgAAAAoHAAACAQAArAAAAHcFAAAl_P__" + "3gMAAAAAAAAyAwAA1wAAAMYCAACtAQAAcAIAAFkCAAA="); // var line = new ym.Polyline(geometry, {}, { strokeWidth: 2, strokeStyle: "longdash" }); map.geoObjects.add(line); map.geoObjects.add(area); pizza.balloon.open(); Regarding the addition of a layer, this example differs little from the previous one. Unless only in the template parameters % d , % z , x and % y are used , not % c as in the first example.
Description of the parameters is in the documentation.
Example 3. Creating your own maps
living example
// var projection = new ym.projection.Cartesian([[0, 0], [100, 100]]); var layer = function(){ return new ym.Layer(function(tile, zoom) { return "http://mt.gmapuploader.com/tiles/bneaLXS8B7/tile-" + zoom + "-" + (tile[1] * Math.pow(2, zoom) + tile[0]) + ".jpg"; }); }; var lineageMap = new ym.MapType('LineageMap', [layer]); ym.mapType.storage.add('lineage#map', lineageMap); var map = new ym.Map('map', { center: [45, 54], zoom: 1, type: "lineage#map" }, { maxZoom: 6, minZoom: 1, projection: projection }); var miniMap = new ym.control.MiniMap(); miniMap.options.set("zoomOffset", 2); // miniMap.setType('lineage#map'); map.controls.add(miniMap); map.controls.add(new ym.control.MapTools(['drag', 'magnifier'])); var zoom = new ym.control.ZoomControl({ customTips: [{ index: 2, value: ''}, { index: 5, value: ''}] }); map.controls.add(zoom); var points = []; for (var i = 0; i < 100; i++) { var coordinates = [Math.floor(Math.random() * 60) + 20, Math.floor(Math.random() * 60) + 20]; points[i] = new ym.Placemark(coordinates, { hintContent: "point " + i }, { iconImageHref: "http://wowimg.zamimg.com/images/Mapper/pin-yellow.png", iconImageSize: [11, 11] }); } var clusterer = new ym.Clusterer(); clusterer.add(points); map.geoObjects.add(clusterer); This example is completely different from the previous two. To begin with, here we add a layer not through the map layer manager , but through the map type storage . As the name implies, we need to create a map type that contains our layer. Which later it will be possible to set the type: “lineage # map” at the initialization of the map and apply the miniMap.setType ('lineage # map') to the minimap.
In the case of the MMORPG and building plans, it makes no sense to work with spherical coordinates, so we use the Cartesian coordinate system, which we apply to the map through the projection option. Now points are added not through longitude and latitude, but through simple x and y.
PS How to cut tiles?
- The application "Preparing a layer of tiles" - if you want to store images on your server
- Gmap Uploader - if you want to depend on a third-party server
Source: https://habr.com/ru/post/142930/
All Articles