New github charts to your attention

We redesigned existing graphics and added three new ones to help you even better explore the repositories hosted on GitHub.
Participants (Contributors).
See the participation of people in the project and their relationship with other participants.
Activity commits.
Activity commits over the last year by week.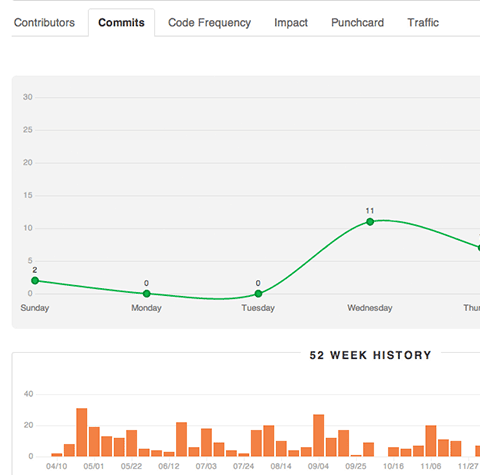
')
Frequency chart code.
Insert and delete code for the entire life of the project.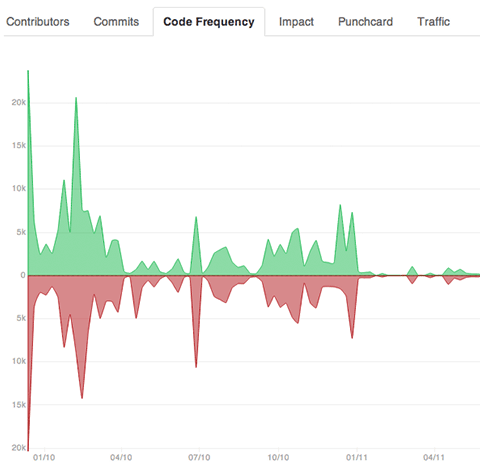
Influence
Individual impact on the project for all time.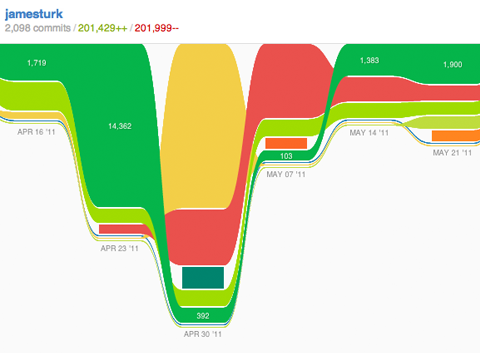
"Card".
Allows you to see the hours and days on which commits are especially frequent.
New github charts are built using the awesome d3 library written by @mbostock
Source: https://habr.com/ru/post/142903/
All Articles