The wonders of trigonometry using canvas
I have long wanted to start learning HTML5 canvas, and finally decided to take it. The first thing I decided to try is to display different shapes using standard lines in “pseudo 3D”. Once upon a time I saw a very interesting way in the plugin for winamp and decided to implement it myself. In 2002, I did it in C ++, but now it's time to transfer this miracle to HTML and JavaScript.
I decided to immediately use the jCanvasScript shell to more easily use the functions associated with the Canvas, and the explorercanvas to support the result in IE8.
Surprises began almost from the beginning. I wanted the canvas to be stretched to full screen (or rather to the entire browser window), but since Canvas dimensions are specified only in pixels, we had to be cunning since the insertion of the canvas tag. Strictly speaking, it is possible to specify the size in percent, but then the image inside will be stretched. Here is what had to be done like this:
')
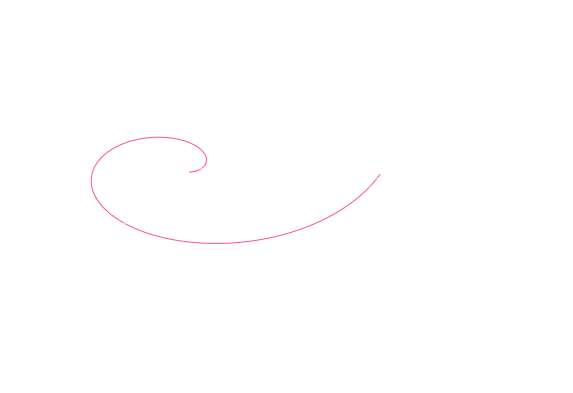
I started with a spiral that rotates in different planes. Because I did it earlier in C ++, then I took the "blanks" and translated their logic into JavaScript. In order to display a graph of a function, you must enter a function that calculates the X and Y coordinates of each point. To display the rotation, a function is needed which changes the variables with each frame on which the angles of inclination in the planes depend.
Initialization code:
The code executed from frame to frame:
Code executed in each frame:
The variable i ranges from 0 to n. The variables x and y will vary from 0 to 1 - this is convenient for converting to the coordinates of the screen depending on its width and height.
Having written one HTML file with a spiral, I decided to experiment with other figures, but because It’s not convenient to produce one file for each shape. I created an HTML file with a built-in editor for pieces of code (Initialization, Frame, Points, and variable mixing). The latter sometimes allows you to portray such bizarre figures that you didn’t guess. Pieces of code are inserted using eval and with an expanded scope, which allows the use of trigonometric functions without writing the name of the Math object.
Well, when the editor was created, of course, there was a need to save and load what was done. You can see it in action here . I think it will be useful to study the behavior of trigonometric functions.
CodeMirror is used to highlight the code .
I decided to immediately use the jCanvasScript shell to more easily use the functions associated with the Canvas, and the explorercanvas to support the result in IE8.
Surprises began almost from the beginning. I wanted the canvas to be stretched to full screen (or rather to the entire browser window), but since Canvas dimensions are specified only in pixels, we had to be cunning since the insertion of the canvas tag. Strictly speaking, it is possible to specify the size in percent, but then the image inside will be stretched. Here is what had to be done like this:
$(window).load(function(){ $("<canvas></canvas>").attr({ 'width': $('body').width(), 'height': $('body').height(), 'id': idCanvas }).appendTo("body"); }); ')
I started with a spiral that rotates in different planes. Because I did it earlier in C ++, then I took the "blanks" and translated their logic into JavaScript. In order to display a graph of a function, you must enter a function that calculates the X and Y coordinates of each point. To display the rotation, a function is needed which changes the variables with each frame on which the angles of inclination in the planes depend.
Initialization code:
var settings = { n : 500, // num of points tx: 0, ty: 0, tz: 0, x1: 0, y1: 0, z1: 0, dtx: 1, dty: 1, dtz: 1, dx: 2, dy: 2, dz: 2, clCol: 9, dir: 1 } The code executed from frame to frame:
tx += 0.01*dtx; ty += 0.01*dty; tz += 0.01*dtz; Code executed in each frame:
x1 = cos(tx+dx*i*PI)*i; y1 = sin(ty-dy*i*PI)*i; z1 = sin(tz-dz*i*PI)*i; x = x1/(2+z1/2); y = y1/(2+z1/2); The variable i ranges from 0 to n. The variables x and y will vary from 0 to 1 - this is convenient for converting to the coordinates of the screen depending on its width and height.
Having written one HTML file with a spiral, I decided to experiment with other figures, but because It’s not convenient to produce one file for each shape. I created an HTML file with a built-in editor for pieces of code (Initialization, Frame, Points, and variable mixing). The latter sometimes allows you to portray such bizarre figures that you didn’t guess. Pieces of code are inserted using eval and with an expanded scope, which allows the use of trigonometric functions without writing the name of the Math object.
Well, when the editor was created, of course, there was a need to save and load what was done. You can see it in action here . I think it will be useful to study the behavior of trigonometric functions.
CodeMirror is used to highlight the code .
Source: https://habr.com/ru/post/142720/
All Articles