Dynamic Binary Instrumentation in Information Security
The complexity of the software grows - programs become more dynamic, and their behavior can only be assessed during implementation. It is much more difficult to make a security assessment (search for vulnerabilities, undocumented features, etc.) of such applications. It is impossible to use only static analysis approaches, since due to the dynamically generated code we cannot even guarantee full coverage of the code during the analysis. Come to the aid of dynamic methods of analysis.
There is such a wonderful technology as dynamic binary instrumentation (Dynamic Binary Instrumentation, DBI), which consists of inserting procedures (in general) into binary executable code. The main charm of this approach is that there is no need for the source code of the application being analyzed - work takes place directly with the binary file.
Instrumentation refers to the process of modifying the program under study for the purpose of analyzing it. Instrumentation procedures are usually responsible for inserting additional code, which are called only once at the occurrence of the necessary event and modify the target program. The added code is an analyzing procedure. These procedures are responsible for carrying out the necessary analysis, modification and monitoring of the studied (target) program and are called whenever a certain code segment is reached or a certain event occurs in the program (process creation, exception occurrence, etc.). Binary application instrumentation can be performed at different levels of program granularity:
• instructions;
• base unit;
• trails;
• procedures;
• sections of the binary file;
• binary image.
')
As a result, special frameworks for dynamic binary instrumentation were developed to create such tools that work during the execution of the program. The tools that can be created with their help are called dynamic binary analyzers (DBA, Dynamic Binary Analysis).
There are four most popular frameworks: PIN , DynamoRIO , DynInst, and Valgrind . You can learn more about each library from my presentation “DBI: Intro” from the ZeroNights conference.
In this article, I would like to dwell on the Intel PIN library, which we actively use in the framework of our DSecRG research center projects , and consider how it can be used to solve problems arising when working with binary applications without source codes.
This library is actively developed and maintained. There is a rather large community around it - pinheads , where you can get an answer to any question you are interested in about PIN.
DBI is actively used by such cool security research centers like Immunity, Zynamics, Rapid7, SourceFire VRT, Coseinc, etc. Knowledge of DBI is already encountered as one of the requirements for software security assessors and exploit development. Here is an example of requirements from a job post for Exploit Engineer to the Metasploit development team:

As an example of working with PIN, consider the implementation of the Shadow Stack, the essence of which is to create your own stack of addresses of program returns. This allows you to identify buffer overflows in the stack when the return address is overwritten. The algorithm of such a tool is very simple: before calling each function, we remember the return address in the Shadow Stack, and before leaving the function, we compare the return address with the value stored in the Shadow Stack.
Graphically, the work of this tool can be represented as follows:

It is fair to note that this tool will work only when overwriting the return address and will not notice anything if the data before the return address is destroyed. To notice the destruction of data within a function, you need to compile a program with a flag from the / RTC family, but here, first, you need to have the source code of the application being studied, and second, usually, the programs are released without it, since it is very affects the performance of the program.
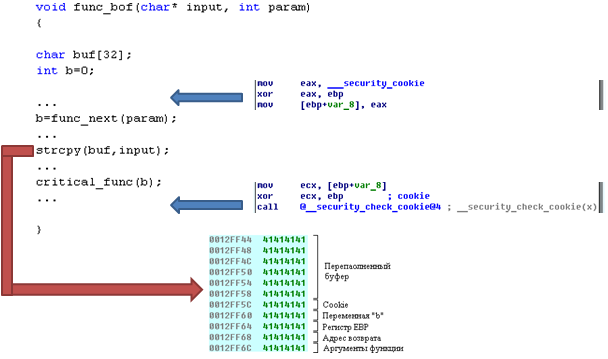
You can also say that a similar task is performed by the / GS flag, which adds a special cookie value before the return address and checks this value before exiting the function. But this flag is not used in all programs and sometimes it is simply not capable of protecting the buffer overflow in the stack from the simplest operation.
For example, in the func_bof () function, the unsafe strcpy () function is called, whose input parameters are not filtered in any way, which leads to a buffer overflow in the stack. As a result, the parameters of the function (variable b), the cookie (if any), the return address are overwritten. But the cookie check does not work right away, because the program has not yet reached the end of the func_bof () function, as a result of which the rewritten variable b falls into the critical_func () function, where it can lead, for example, to integer overflow or negatively affect other data will go further, with the result that the program will fall far from the real place of the problem. Using the simplest modification of the above code, you can check the return address of a function even when calling child functions (let's leave it as homework), which will allow identifying this problem before calling critical_func ().
And finally, here is a list of interesting public security projects implemented using PIN:
- Shellcode dumper - standard shellcode dumper, the principle of which is based on the transfer of control to the stack or heap.
- Moflow-mitigations is a prototype that identifies ROP shellcodes and JIT shellcodes.
- Code-coverage-analysis-tools - code coverage analyzer.
- RunTracer - a set of tools for tracking program control flow.
- Kerckhoffs is a tool for semi-automatic detection of cryptographic primitives in programs.
- VERA - a tool for visualization of the program.
- Tripoux - malware packer analyzer.
- Privacy Scope - a tool for detecting leaks of critical information.
- Tartetatintools - a set of tools for analyzing malicious code.
There are also very interesting implementations of integrating the results of the work of PIN-tools with the IDA Pro disassembler, which plays the role of a visualizer:
- DiffCov - a set of tools for recording the executed basic blocks of the program.
- runtime-tracer - creates a program execution trace with register values and processed memory sections.
This is not a complete list of security projects implemented using PIN, but it seems to me that this will be enough to start making your pintool tools.
I also strongly advise all those interested in DBI / PIN for information security to pay attention to the workshop “Binary instrumentation for security professionals” ( slides , examples ) from my good friend Gal Diskin from Intel. I was lucky to have a hand in this course. It was read at hacker conferences such as BlackHat, DEFCON and HackLu.
There is such a wonderful technology as dynamic binary instrumentation (Dynamic Binary Instrumentation, DBI), which consists of inserting procedures (in general) into binary executable code. The main charm of this approach is that there is no need for the source code of the application being analyzed - work takes place directly with the binary file.
Instrumentation refers to the process of modifying the program under study for the purpose of analyzing it. Instrumentation procedures are usually responsible for inserting additional code, which are called only once at the occurrence of the necessary event and modify the target program. The added code is an analyzing procedure. These procedures are responsible for carrying out the necessary analysis, modification and monitoring of the studied (target) program and are called whenever a certain code segment is reached or a certain event occurs in the program (process creation, exception occurrence, etc.). Binary application instrumentation can be performed at different levels of program granularity:
• instructions;
• base unit;
• trails;
• procedures;
• sections of the binary file;
• binary image.
')
As a result, special frameworks for dynamic binary instrumentation were developed to create such tools that work during the execution of the program. The tools that can be created with their help are called dynamic binary analyzers (DBA, Dynamic Binary Analysis).
There are four most popular frameworks: PIN , DynamoRIO , DynInst, and Valgrind . You can learn more about each library from my presentation “DBI: Intro” from the ZeroNights conference.
In this article, I would like to dwell on the Intel PIN library, which we actively use in the framework of our DSecRG research center projects , and consider how it can be used to solve problems arising when working with binary applications without source codes.
This library is actively developed and maintained. There is a rather large community around it - pinheads , where you can get an answer to any question you are interested in about PIN.
DBI is actively used by such cool security research centers like Immunity, Zynamics, Rapid7, SourceFire VRT, Coseinc, etc. Knowledge of DBI is already encountered as one of the requirements for software security assessors and exploit development. Here is an example of requirements from a job post for Exploit Engineer to the Metasploit development team:
As an example of working with PIN, consider the implementation of the Shadow Stack, the essence of which is to create your own stack of addresses of program returns. This allows you to identify buffer overflows in the stack when the return address is overwritten. The algorithm of such a tool is very simple: before calling each function, we remember the return address in the Shadow Stack, and before leaving the function, we compare the return address with the value stored in the Shadow Stack.
#include <stdio.h> #include "pin.H" #include <stack> typedef struct { ADDRINT address; ADDRINT value; } pAddr; // Shadow Stack stack<pAddr> protect; FILE * logfile; //-------------------------------------------------------------------------------------- VOID Fini(INT32 code, VOID *v) { fclose(logfile); } //-------------------------------------------------------------------------------------- VOID RtnEntry(ADDRINT esp, ADDRINT addr) { pAddr tmp; tmp.address = esp; tmp.value = *((ADDRINT *)esp); // Shadow Stack protect.push(tmp); } //-------------------------------------------------------------------------------------- VOID RtnExit(ADDRINT esp, ADDRINT addr) { // Shadow Stack if (protect.empty()) { fprintf(logfile, "WARNING! protection list empty\n"); return; } pAddr orig = protect.top(); ADDRINT cur_val = (*((ADDRINT *)orig.address)); // Shadow Stack if (orig.value != cur_val) { fprintf(logfile, "Overwrite at: %x old value: %x, new value: %x\n", orig.address, orig.value, cur_val ); } // Shadow Stack protect.pop(); } //-------------------------------------------------------------------------------------- // VOID Routine(RTN rtn, VOID *v) { RTN_Open(rtn); SEC sec = RTN_Sec(rtn); IMG img = SEC_Img(sec); if ( IMG_IsMainExecutable(img) && (SEC_Name(sec) == ".text") ) { // , (RtnEntry) RTN_InsertCall(rtn, IPOINT_BEFORE,(AFUNPTR)RtnEntry, IARG_REG_VALUE, REG_ESP, IARG_INST_PTR, IARG_END); // , (RtnExit) RTN_InsertCall(rtn, IPOINT_AFTER ,(AFUNPTR)RtnExit, IARG_REG_VALUE, REG_ESP, IARG_INST_PTR, IARG_END); } RTN_Close(rtn); } //-------------------------------------------------------------------------------------- INT32 Usage() { PIN_ERROR( "This Pintool logs function return addresses in main module and reports modifications\n" + KNOB_BASE::StringKnobSummary() + "\n"); return -1; } //-------------------------------------------------------------------------------------- int main(int argc, char *argv[]) { // PIN_InitSymbols(); // PIN if (PIN_Init(argc, argv)) { return Usage(); } // - logfile = fopen("protection.out", "w"); // , RTN_AddInstrumentFunction(Routine, 0); // , PIN_AddFiniFunction(Fini, 0); // PIN_StartProgram(); return 0; } Graphically, the work of this tool can be represented as follows:
It is fair to note that this tool will work only when overwriting the return address and will not notice anything if the data before the return address is destroyed. To notice the destruction of data within a function, you need to compile a program with a flag from the / RTC family, but here, first, you need to have the source code of the application being studied, and second, usually, the programs are released without it, since it is very affects the performance of the program.
You can also say that a similar task is performed by the / GS flag, which adds a special cookie value before the return address and checks this value before exiting the function. But this flag is not used in all programs and sometimes it is simply not capable of protecting the buffer overflow in the stack from the simplest operation.
For example, in the func_bof () function, the unsafe strcpy () function is called, whose input parameters are not filtered in any way, which leads to a buffer overflow in the stack. As a result, the parameters of the function (variable b), the cookie (if any), the return address are overwritten. But the cookie check does not work right away, because the program has not yet reached the end of the func_bof () function, as a result of which the rewritten variable b falls into the critical_func () function, where it can lead, for example, to integer overflow or negatively affect other data will go further, with the result that the program will fall far from the real place of the problem. Using the simplest modification of the above code, you can check the return address of a function even when calling child functions (let's leave it as homework), which will allow identifying this problem before calling critical_func ().
And finally, here is a list of interesting public security projects implemented using PIN:
- Shellcode dumper - standard shellcode dumper, the principle of which is based on the transfer of control to the stack or heap.
- Moflow-mitigations is a prototype that identifies ROP shellcodes and JIT shellcodes.
- Code-coverage-analysis-tools - code coverage analyzer.
- RunTracer - a set of tools for tracking program control flow.
- Kerckhoffs is a tool for semi-automatic detection of cryptographic primitives in programs.
- VERA - a tool for visualization of the program.
- Tripoux - malware packer analyzer.
- Privacy Scope - a tool for detecting leaks of critical information.
- Tartetatintools - a set of tools for analyzing malicious code.
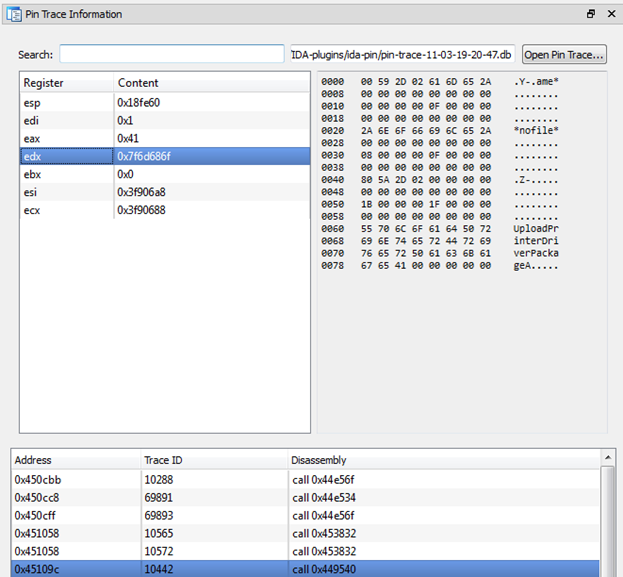
There are also very interesting implementations of integrating the results of the work of PIN-tools with the IDA Pro disassembler, which plays the role of a visualizer:
- DiffCov - a set of tools for recording the executed basic blocks of the program.
- runtime-tracer - creates a program execution trace with register values and processed memory sections.
This is not a complete list of security projects implemented using PIN, but it seems to me that this will be enough to start making your pintool tools.
I also strongly advise all those interested in DBI / PIN for information security to pay attention to the workshop “Binary instrumentation for security professionals” ( slides , examples ) from my good friend Gal Diskin from Intel. I was lucky to have a hand in this course. It was read at hacker conferences such as BlackHat, DEFCON and HackLu.
Source: https://habr.com/ru/post/142575/
All Articles