Let's pause. A way to improve thread synchronization

Pause - a temporary silence, a break in the sound of the musical work as a whole or of any part or individual voice.
[Wikipedia]
Surprisingly, but sometimes it happens that in order to do something as a whole faster, you have to do it more slowly or even with pauses. For example, when implementing active spin-wait waitings in a multi-threaded code, it is recommended to use the pause instruction, which, according to the Intel Instruction Set Reference , makes this wait most effective. “What nonsense!” - you will say. How can expectation be effective? Microprocessor developers claim that with active waiting with the pause instruction, the chip consumes much less energy since the days of Pentium 4. What else can be the efficiency of waiting? Talk about this below.
In fact, in this post I will not compare the effectiveness of the implementation of spin-wait'ov - this is not interesting. What seemed to me interesting is to analyze in detail one case of profiling a parallel OpenMP application, in which, if the problem is presented simply, multiple threads struggle for one shared resource. At the same time, the operation time for this resource is negligible compared to the overhead of synchronization. It is clear that programmers made a mistake when designing the implementation of their task in a parallel application - such errors are often encountered and are the subject of discussions in the ISN blogosphere ( example ). However, it was not so easy to immediately understand what was happening, as the project is not simple and its profiling and analysis takes some time. To facilitate understanding of the problem and speeding up the tests, I reduced the program to a simple test, which, if I look at it with an experienced eye, immediately reveals an error in myself. But so we all know how to do, immediately find problems in simple tests. My task is to show the approximate course of the research (because it does not reach the methodology) and the profiler’s capabilities, which allow making conclusions about the problems in the code and further searching for methods to solve them.
')
As I already mentioned, we found out that the code that we are examining implements multi-threaded access to a variable that is protected by a critical section. From the results of Hotspot profiling, you can see that the ComputePot function takes up the most processor time, and there are wait calls — helper functions from the libomp5.so library, which are called when creating and destroying parallel OpenMP regions (fork / join).
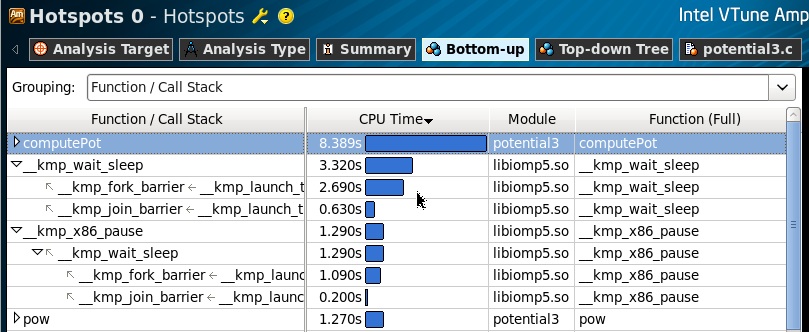
If we look at the distribution of the execution time in the source code, we see that the actual functions of the computation (pow, sqrt) in the body of the region neglect a negligible part of the entire execution time of the computePot function. And the problem of performance lies in the plane of synchronization of access of OpenMP streams to the variable lPot. Redundant access of many threads to a single resource on a multi-core machine has never been effective. Once again I will make a reservation that this example is greatly simplified, and from the point of view of the local variable lPot, the critical section is not needed here, but we leave it in place, otherwise the example will not reflect the implementation from which it was reduced.

Next, we need to understand where there is a possibility of reducing the overhead of synchronization. The first impulse was to rewrite the implementation on pthreads, thereby eliminating the likelihood of overhead of the OpenMP library. Indeed, what could be simpler - we create pthreads threads and synchronize access to the variable using pthread_mutex_lock / unlock. I’ll say right away that in a real example and in real terms it was almost impossible to do this, since I would have to write a lot of code that shares the load and data between the threads. We will try then on this microtest. The result turned out to be expected - no significant performance gain was observed. Well, then we will continue to explore the OpenMP library (the preference was made to it, since “tinkering” in it is much nicer than libpthread, at least because its developers are sitting side by side, and you can always get up with their stupid questions).
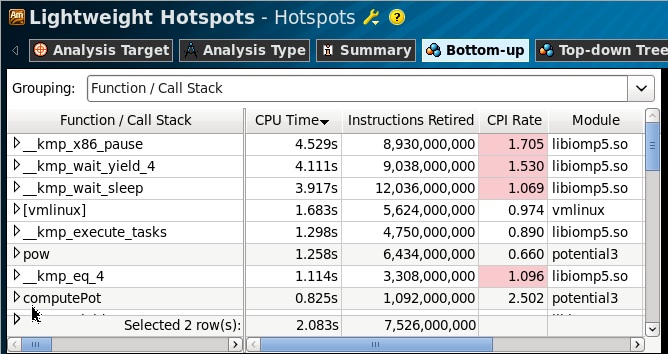
To analyze library and system calls, we need a Lightweight Hotspots profile, which is based on Hardware Event-based Sampling (EBS) technology and is known for profiling all calls, both at the user level and at the kernel level. In this case, we do not need any special processor counters, since we measure only our own time for executing functions (self-time).
As we can see from the profile, almost all the time was spent in waiting functions of the OpenMP library: x86_pause, wait_yield, wait_sleep, and part of the time in the Linux kernel, the calls of which we cannot profile without having characters for the kernel module. What does this information give us (except for the fact that, at least, we do not need to "tune the core")? Due to the fact that the profile provided by the EBS technology is flat, then nothing. Flat - then we have a list of functions that scored the most samples (performed most of the time), aggregated by calls. That is, these functions could be called by anyone appropriately and as many times as you like. We need a “convex” profile to understand where these functions were called from, who was expecting.
The new version of VTune Amplifier XE 2013 Beta has such an opportunity. This completely new technology, based on the BTR (Branch Target Register) processor trace, allows you to restore the call stack, even if it was made a function at the kernel level. This is a very “tasty” feature, especially useful in cases where any processor events (not necessarily time) are concentrated in system calls, and we need to find out which functions in the user code were initiated by them.

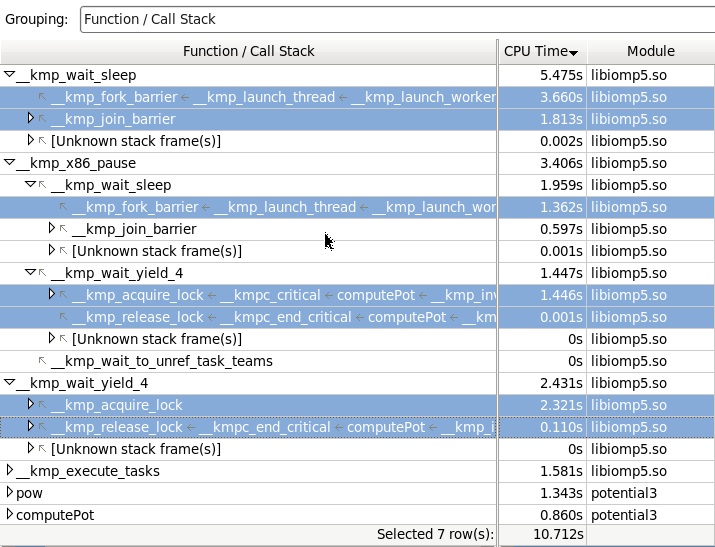
Collecting Lightweight Hotspot profile with stacks, we get the following picture. (Here it is necessary to take into account that collecting stacks, even with the help of a processor, is a somewhat costly operation, allowing for the overhead of program execution, so the time parameters will change slightly).
What we see here: the main consumer of the time is the function of the library wait_yield_4, which is called by the input stack in the critical section in the computePot function, and which ultimately will call the x86_pause function.
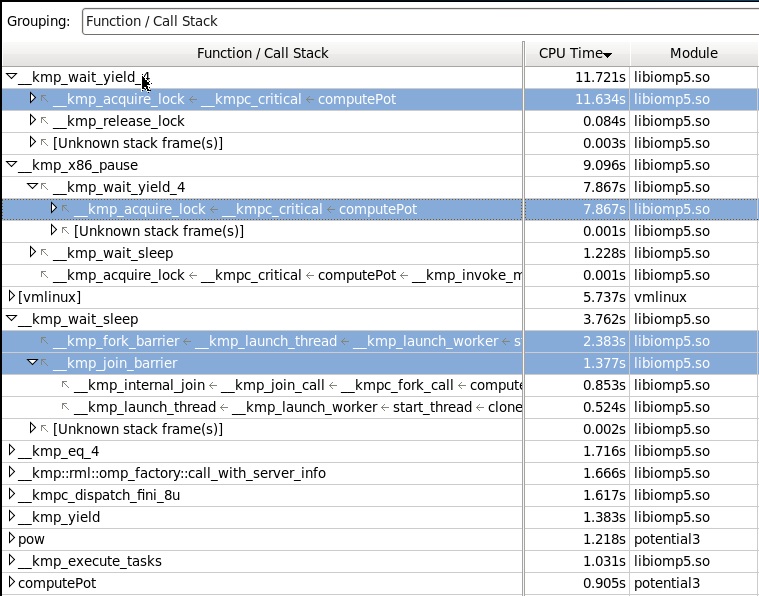
It is not difficult to see (switching to the Assembly view) that the latter will cause the assembler pause instruction.

As for wait_sleep, it also calls x86_pause, but it is responsible for waiting at the beginning and end of a parallel region.
Now let's see what went into the kernel calls (unresolvable characters, therefore the module name is [vmlinux] in brackets). Here we see that most of the “moves to the core” occurred through the yeild library function in an attempt to capture the critical section.
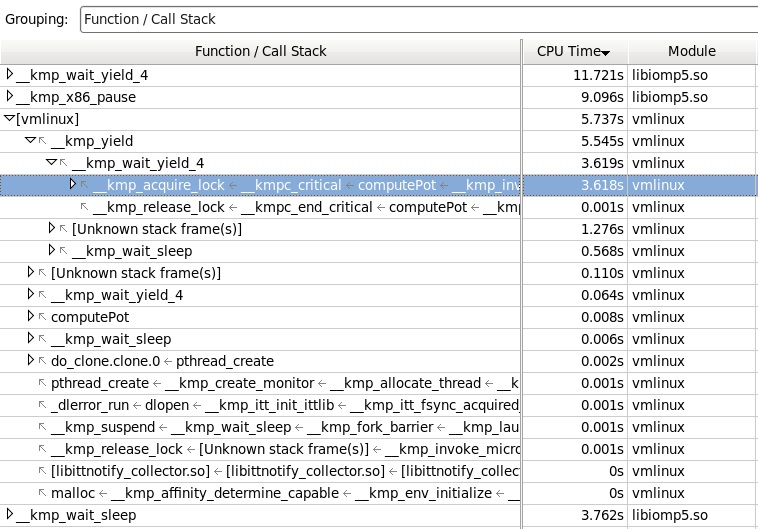
Here it is already possible to play. The fact is that when an unsuccessful attempt to capture the critical section in OpenMP, the control is not immediately transferred to the kernel, we actually get the wait in the spin-wait (wait_yield_4) using the pause instruction. However, if during this wait (tens of milliseconds) the check of the flag did not show that the mutex is free, the next yield function is called, passing control to the kernel and “sleeping” the thread until it is woken by the core signal. We can increase the wait time in spin-wait to reduce the likelihood of transition to kernel mode. If you read documents on the OpenMP library, then from there you can get that there are useful global settings, such as:
KMP_LIBRARY - run-time execution mode [Serial | Turnaround | Throughput (default)]
KMP_BLOCKTIME - the amount of time to wait before sleeping [0 | N (default 200 ms) | infinite]
We configure OpenMP run-time so that the threads are as active as possible, and try not to transfer control to other threads (this is exactly what happens in situations with thread contention when the threads are fighting for shared resources). Install:
KMP_LIBRARY = Turnaround
KMP_BLOCKTIME = infinite
It is believed that in systems where only our program works (processors are not busy with intensive execution of other applications) such a setting brings the greatest performance increase for synchronization. However, it should be remembered that if the number of threads in a program is much more than the number of processors, and they fight with each other for the right to stand in the execution queue, the exact opposite settings will be optimal, that is: KMP_LIBRARY = Throughput , KMP_BLOCKTIME = 0 .
We start again profiling and study the results. Let's start by comparing the results. We see that the waiting time in spin-waits has decreased, and most importantly, the wait in the core has almost disappeared (which we were trying to achieve). In general, the program has worked about 2 times faster.

Now the main waiting time is in the wait_sleep function called when creating and destroying a parallel region, and the pauses caused by wait_yield_4 from the capture of the critical section (acquire_lock) have decreased, apparently due to the fact that the threads have got more chances to capture the section.
It is necessary to mention once again that such a performance increase with changes in OpenMP run-time settings was obtained in this simple example, which, in fact, is a degenerate case on which it is good to measure (and brag about success). In the real application is not so simple, and the success is more modest. However, the use of this approach allows us to study the problems arising from excessive synchronization, and try to solve them in any ways.
Source: https://habr.com/ru/post/142382/
All Articles