What do static analysis and search engines have in common? Good top!
The developers of search engines like Google / Yandex and the developers of static code analysis tools solve in a certain sense a very similar task. Both those and others should provide the user with some sample with resources that “meet” the wishes of the user. No, of course, ideally, search engine developers would like to limit themselves to the “I'm Feeling Lucky!” Button (I'm Feeling Lucky). And developers of code analysis tools want to give only a list of real errors in the code. But the reality as always imposes restrictions. Want to find out how we are fighting a cruel reality when developing PVS-Studio?
So how in the conditions of the existing restrictions the task of search engines looks? Without claiming to be complete, I will say that the search engine should give the user to his request (indicated explicitly) several answers. That is, to issue several sites that may be of interest to the user. In this case, you can still show him advertising.
')
From the point of view of code analyzers, the task looks almost the same. To the already implicit user question (“Smart program, show me where I have errors in the code?”) The tool should point out the code fragments in the program that are most likely to interest the user.
Those who used static code analyzers (no matter for which language) understand that any tool has false positives. This is a situation where, “formally” by code, there is an error from the point of view of the tool, but the person sees that there is no error. And then the human perception comes into play. So imagine a situation.
The man downloaded the trial version of the code analyzer, launched it. She even (about a miracle!) Did not fall and somehow worked. And she gave him a list of several tens / hundreds / thousands of messages. If there are several dozen messages, then he will view them all. Find something interesting - think about the constant use of the tool and its purchase. Will not find - quickly forgets. But if the list contains hundreds or thousands of messages, the user will view only a few of them. And on the basis of what he saw will already be concluded about the tool. Therefore, it is very important that the user can immediately get "eyes" on interesting diagnostic messages. Therein lies the similarity in the approaches to the "right top (top)" among the developers of search engines and static code analysis tools.
In order for the PVS-Studio users to see the most interesting posts first of all, we have a few tricks.
First, all messages are divided at the level similar to the Compiler Warning Level. And by default, when you first start, only messages of the first and second levels are shown, and the third level is turned off.
Secondly, our diagnostics are divided into the classes “General Analysis”, “64-bit diagnostics”, “OpenMP diagnostics”. At the same time, again, by default, OpenMP and 64-bit diagnostics are disabled, and the user does not see them. This does not mean that they are bad, stupid and generally buggy. It's just that the probability to meet the most interesting errors among the errors of the General Analysis category is much higher. And if the user has found something interesting there, then, most likely, he will turn on other diagnostics, and will work with them if he needs them, of course.
Thirdly, we constantly struggle with false positives.
We have an internal tool that allows you to do a statistical (not to be confused with “static”!) Analysis of the results of our code analyzer. It allows you to evaluate three parameters:
Let's take a look at the example of the Miranda IM project, and see how we use this internal tool.
Immediately I will say that this post is not about the errors found in Miranda IM. Who wants to look at the errors - refer to this note.
So, we open the test result (plog-file) in our internal tool, turn off the 3rd level of errors and leave only the GA analyzer (General Analysis). As a result, the distribution of errors will be as in Figure 1.

Figure 1 - The distribution of errors in the project Miranda IM.
The colored sectors are more than 2.5% of the “responses” of a particular diagnosis of the total number of problems detected. Black - less than 2.5%. It can be seen that the most common errors were with codes V547, V595 and V560. Remember these codes.
Figure 2 shows the average number of errors of each type per project file (i.e., their average density per project).

Figure 2 - The average density of errors in the project Miranda IM.
This graph shows that errors with V547, V595 and V560 codes occur approximately 1.5 to 2.5 times per file. This is, in fact, a normal indicator and there is probably no reason to “fight” these errors in terms of false positives. But finally this can confirm the third graph for these errors, shown in Figures 3,4,5.

Figure 3 - Distribution of errors V547 in the project Miranda IM in comparison with their average density.
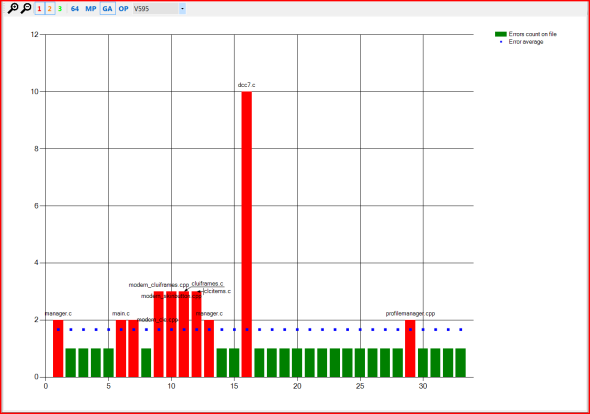
Figure 4 - Distribution of errors V595 in the project Miranda IM in comparison with their average density.

Figure 5 - The distribution of errors V560 in the project Miranda IM in comparison with their average density.
In Figures 3-5, the names of individual files go horizontally, the number of times this or that error was issued for a specific file, vertically. Red columns are files in which the error was issued more than the average (blue dots) of the number of times for this type of error.
Then we look into these “red” files and make a decision - if there is a false positive, and it happens quite often in other projects, then we fight with it. If there really is a mistake, and besides with the help of copy-paste technology that has been rapidly multiplied, then there is nothing to “improve” here.
In this note, I deliberately do not cite examples of code for which the analyzer swore, so as not to clutter the text.
In other words, by building a bunch of similar graphs and analyzing them, we can easily see where our analyzer misses, and correct these places. This confirms the old truth that the visual presentation of the "boring" data allows you to better see the problem you are looking for.
The attentive reader noticed in the pictures, in addition to the three standard analyzer buttons (GA, 64, MP), another OP button - short for “optimization”. In PVS-Studio 4.60 we introduced a new group of diagnostic rules related to micro-optimizations. Diagnosing possible micro-optimizations is a rather ambiguous feature of our analyzer. Someone is very happy to find a place where a large object is transferred to a function not by reference, but by copying ( V801 ). Someone significantly saves memory by reducing the size of structures for large arrays of objects ( V802 ). And someone thinks all this is stupidity and premature optimization. It all depends on the type of project.
In any case, analyzing the issue of our instrument, we came to the need:
This is how a new OP button appeared in the PVS-Studio Output Window (Figure 6):
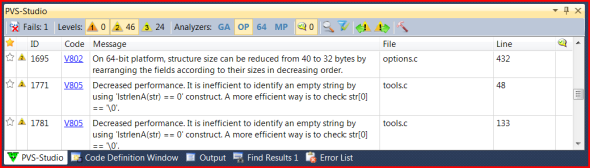
Figure 6 - The OP button (optimization) appeared in PVS-Studio 4.60.
By the way, in the same version, we significantly reduced the number of false positives for analyzing 64-bit problems.
I suggest that you download the new version of PVS-Studio and check how well recommendations for micro-optimization are issued for your code.
The developers of static code analyzers, as well as the developers of search engines, are interested in the adequate output of the work. Both those, and others apply many receptions for this, including methods of the statistical analysis. In this post, I showed how we do it while developing PVS-Studio.
I have a small question for those who have used (or at least played) PVS-Studio or any other code analyzer. Do you think the end user of the code analyzer needs the graphs provided in the article in the form of an end-user tool? Or, in another way, if your code analyzer contained such diagrams, would you be able to learn something from them? Or is it exclusively an “for internal needs” tool? Please share your opinion by writing to us or here in the comments.
Introduction
So how in the conditions of the existing restrictions the task of search engines looks? Without claiming to be complete, I will say that the search engine should give the user to his request (indicated explicitly) several answers. That is, to issue several sites that may be of interest to the user. In this case, you can still show him advertising.
')
From the point of view of code analyzers, the task looks almost the same. To the already implicit user question (“Smart program, show me where I have errors in the code?”) The tool should point out the code fragments in the program that are most likely to interest the user.
Those who used static code analyzers (no matter for which language) understand that any tool has false positives. This is a situation where, “formally” by code, there is an error from the point of view of the tool, but the person sees that there is no error. And then the human perception comes into play. So imagine a situation.
The man downloaded the trial version of the code analyzer, launched it. She even (about a miracle!) Did not fall and somehow worked. And she gave him a list of several tens / hundreds / thousands of messages. If there are several dozen messages, then he will view them all. Find something interesting - think about the constant use of the tool and its purchase. Will not find - quickly forgets. But if the list contains hundreds or thousands of messages, the user will view only a few of them. And on the basis of what he saw will already be concluded about the tool. Therefore, it is very important that the user can immediately get "eyes" on interesting diagnostic messages. Therein lies the similarity in the approaches to the "right top (top)" among the developers of search engines and static code analysis tools.
How to ensure the "correct issue" for static analysis?
In order for the PVS-Studio users to see the most interesting posts first of all, we have a few tricks.
First, all messages are divided at the level similar to the Compiler Warning Level. And by default, when you first start, only messages of the first and second levels are shown, and the third level is turned off.
Secondly, our diagnostics are divided into the classes “General Analysis”, “64-bit diagnostics”, “OpenMP diagnostics”. At the same time, again, by default, OpenMP and 64-bit diagnostics are disabled, and the user does not see them. This does not mean that they are bad, stupid and generally buggy. It's just that the probability to meet the most interesting errors among the errors of the General Analysis category is much higher. And if the user has found something interesting there, then, most likely, he will turn on other diagnostics, and will work with them if he needs them, of course.
Thirdly, we constantly struggle with false positives.
So how do you do it all?
We have an internal tool that allows you to do a statistical (not to be confused with “static”!) Analysis of the results of our code analyzer. It allows you to evaluate three parameters:
- The share of errors in the project - the prevalence of errors (by code) at the project level (Project Level Share).
- Average error density is the ratio of the number of errors of one type to the number of files in which this type of errors occurs (Average Density (project level)).
- Distribution of errors of one type by project files in comparison with their average density (Errors count on file).
Let's take a look at the example of the Miranda IM project, and see how we use this internal tool.
Immediately I will say that this post is not about the errors found in Miranda IM. Who wants to look at the errors - refer to this note.
So, we open the test result (plog-file) in our internal tool, turn off the 3rd level of errors and leave only the GA analyzer (General Analysis). As a result, the distribution of errors will be as in Figure 1.
Figure 1 - The distribution of errors in the project Miranda IM.
The colored sectors are more than 2.5% of the “responses” of a particular diagnosis of the total number of problems detected. Black - less than 2.5%. It can be seen that the most common errors were with codes V547, V595 and V560. Remember these codes.
Figure 2 shows the average number of errors of each type per project file (i.e., their average density per project).
Figure 2 - The average density of errors in the project Miranda IM.
This graph shows that errors with V547, V595 and V560 codes occur approximately 1.5 to 2.5 times per file. This is, in fact, a normal indicator and there is probably no reason to “fight” these errors in terms of false positives. But finally this can confirm the third graph for these errors, shown in Figures 3,4,5.
Figure 3 - Distribution of errors V547 in the project Miranda IM in comparison with their average density.
Figure 4 - Distribution of errors V595 in the project Miranda IM in comparison with their average density.
Figure 5 - The distribution of errors V560 in the project Miranda IM in comparison with their average density.
In Figures 3-5, the names of individual files go horizontally, the number of times this or that error was issued for a specific file, vertically. Red columns are files in which the error was issued more than the average (blue dots) of the number of times for this type of error.
And what to do with these charts?
Then we look into these “red” files and make a decision - if there is a false positive, and it happens quite often in other projects, then we fight with it. If there really is a mistake, and besides with the help of copy-paste technology that has been rapidly multiplied, then there is nothing to “improve” here.
In this note, I deliberately do not cite examples of code for which the analyzer swore, so as not to clutter the text.
In other words, by building a bunch of similar graphs and analyzing them, we can easily see where our analyzer misses, and correct these places. This confirms the old truth that the visual presentation of the "boring" data allows you to better see the problem you are looking for.
And what is this OP button in the pictures?
The attentive reader noticed in the pictures, in addition to the three standard analyzer buttons (GA, 64, MP), another OP button - short for “optimization”. In PVS-Studio 4.60 we introduced a new group of diagnostic rules related to micro-optimizations. Diagnosing possible micro-optimizations is a rather ambiguous feature of our analyzer. Someone is very happy to find a place where a large object is transferred to a function not by reference, but by copying ( V801 ). Someone significantly saves memory by reducing the size of structures for large arrays of objects ( V802 ). And someone thinks all this is stupidity and premature optimization. It all depends on the type of project.
In any case, analyzing the issue of our instrument, we came to the need:
- select optimization diagnostics in a separate group so that they can be easily hidden / shown;
- by default, disable them, as they can “fill in” the list of errors with those diagnostics that not everyone likes.
This is how a new OP button appeared in the PVS-Studio Output Window (Figure 6):
Figure 6 - The OP button (optimization) appeared in PVS-Studio 4.60.
By the way, in the same version, we significantly reduced the number of false positives for analyzing 64-bit problems.
I suggest that you download the new version of PVS-Studio and check how well recommendations for micro-optimization are issued for your code.
Conclusion
The developers of static code analyzers, as well as the developers of search engines, are interested in the adequate output of the work. Both those, and others apply many receptions for this, including methods of the statistical analysis. In this post, I showed how we do it while developing PVS-Studio.
Question from the audience
I have a small question for those who have used (or at least played) PVS-Studio or any other code analyzer. Do you think the end user of the code analyzer needs the graphs provided in the article in the form of an end-user tool? Or, in another way, if your code analyzer contained such diagrams, would you be able to learn something from them? Or is it exclusively an “for internal needs” tool? Please share your opinion by writing to us or here in the comments.
Source: https://habr.com/ru/post/142300/
All Articles