Drawing grid graphs of three-dimensional functions and contour lines to them
The article is something like a “practical guide” for building very interesting three-dimensional graphs of functions of the form z = f (x, y), with an example implementation in C #.
We will draw in the Chart component, of course, you can use any canvas-like element. With a large number of points, there will be delays in drawing, but this component is easy to use and will fit perfectly for demonstration.
We build the schedule
To do this, we need a grid or field, each node of which will have x, y coordinates and contain the value of z. This grid can be filled in any way; once we plot the function, we will fill it with the values of this function (z = f (x, y)). The step between two consecutive x or y values is chosen equal to one, for a simpler and more illustrative demonstration, the dimension of the grid is N x N. The values in the grid nodes are enough to be read once. To convert three-dimensional coordinates into two-dimensional ones and to rotate the graph, we will use the rotation matrix and Euler angles .

Denote the angles α, β and γ by the angles a, b, and c, respectively, and use their values in degrees. We write the matrix in terms of the coefficients:
    |  l1, l2, l3 |
  M = |  m1, m2, m3 |
    |  n1, n2, n3 |
 l1 = cos (a) * cos (c) - cos (b) * sin (a) * sin (c)
 m1 = sin (a) * cos (c) + cos (b) * cos (a) * sin (c)
 n1 = sin (b) * sin (c)
 l2 = -cos (a) * sin (c) + cos (b) * sin (a) * cos (c)
 m2 = -sin (a) * sin (c) + cos (b) * cos (a) * cos (c)
 n2 = sin (b) * cos (c)
 l3 = sin (b) * sin (a)
 m3 = -sin (b) * cos (a)
 n3 = cos (b)
We write the final transformation from three-dimensional coordinates into two-dimensional:
X = l 1 x + l 2 y + l 3 z
Y = m 1 x + m 2 y + m 3 z
x, y, z are the “internal” coordinates for the graph, X, Y are the final screen coordinates. We will not need the coefficients n1, n2 and n3 for this task.
double[,] a; // N x N … double X, Y; // x for (int x = 0; x < N; x++) { for (int y = 0; y < N; y++) { X = l1() * (x - N / 2.0) + l2() * (y - N / 2.0) + l3() * a[x, y]; Y = m1() * (x - N / 2.0) + m2() * (y - N / 2.0) + m3() * a[x, y]; chart1.Series[n].Points.AddXY(X, Y); } n++; } // y for (int y = 0; y < N; y++) { for (int x = 0; x < N; x++) { X = l1() * (x - N / 2.0) + l2() * (y - N / 2.0) + l3() * a[x, y]; Y = m1() * (x - N / 2.0) + m2() * (y - N / 2.0) + m3() * a[x, y]; chart1.Series[n].Points.AddXY(X, Y); } n++; } Add events at which the angles will change and the graph will rotate. For example, it will move the cursor while holding the left mouse button and change the angles b and c:
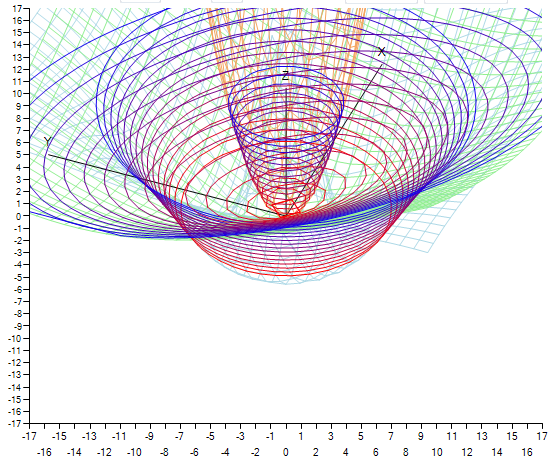
bool onmove = false; Point startpos; … private void chart1_MouseDown(object sender, MouseEventArgs e) { if (e.Button == MouseButtons.Left) { onmove = true; startpos = e.Location; } } private void chart1_MouseMove(object sender, MouseEventArgs e) { if (onmove) { if ((startpos.Y - eY) < 0) b--; if ((startpos.Y - eY) > 0) b++; if ((startpos.X - eX) < 0) c--; if ((startpos.X - eX) > 0) c++; if (b > 359) b = 0; if (c > 359) c = 0; if (b < 0) b = 359; if (c < 0) c = 359; drawscene(); } } private void chart1_MouseUp(object sender, MouseEventArgs e) { if (e.Button == MouseButtons.Left) onmove = false; } Check on the test function z = x 2 + y 2 :
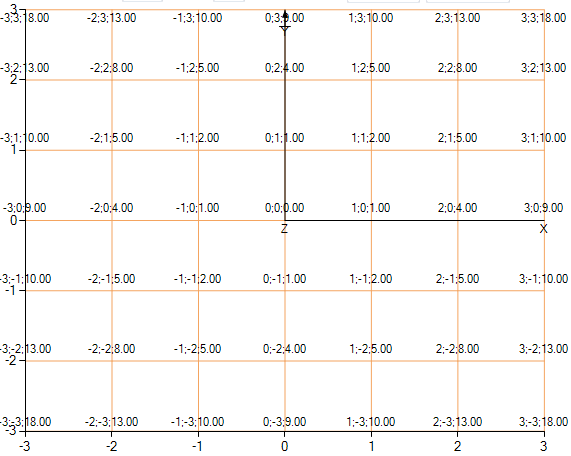
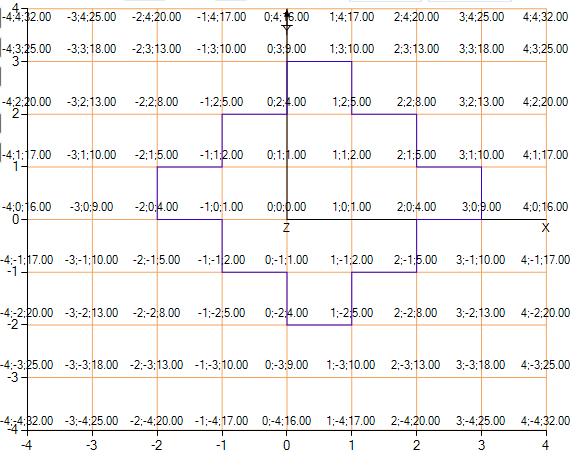
A top view of the function where you can see that same grid and show the values in the nodes.
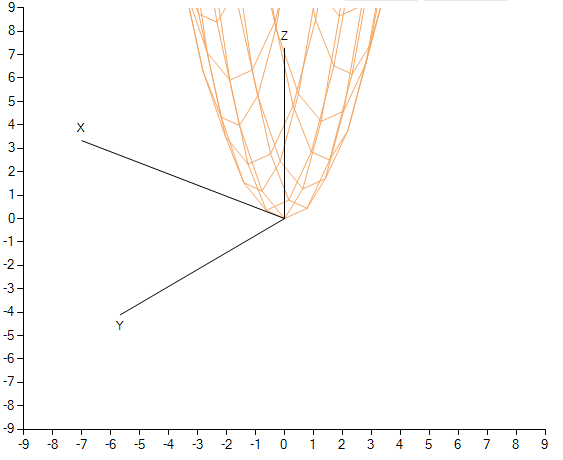
View of the function at an angle.
It may be worthwhile to change the angles in a different way, while rotating using all 3 angles and using the grid in increments of less than 1, but we have simplified the situation.
Building isolines
We use the Moving Squares algorithm (“Marching squares”), a fairly detailed description is given on Wikipedia. Google also gives a very good article , which describes this algorithm and is implemented in C #.
The essence briefly:
1. It is required to find the initial position - where the isoline will go.
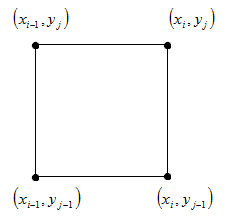
2. Then compare the values in the adjacent grid nodes that form a square with the vertices: (x i , y j ), (x i-1 , y j ), (x i , y j-1 ), (x i-1 , y j-1 ).
3. Select the further direction of the bypass, depending on the value obtained in step 2, and proceed to the next point, in which again do step 2.
4. Perform until we get back to the starting position or reach the edge of the grid.
There can be a total of 16 options:

Let's not write all the code again, take a part of the code from that article and change it for our task:
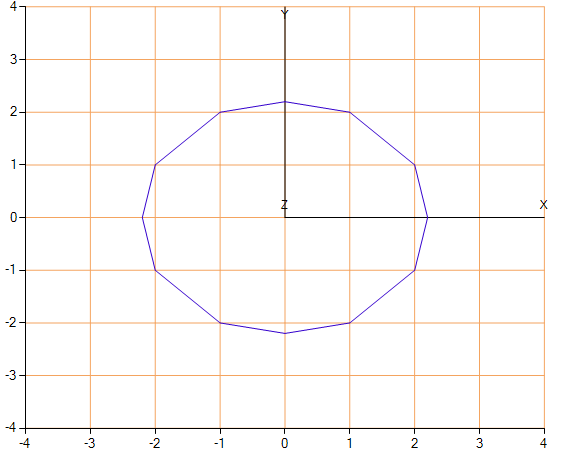
enum dir { None, Up, Left, Down, Right } dir prevStep; dir nextStep; bool border; int startx, starty; void findstartpos() { for (int y = 0; y < N; y++) for (int x = 0; x < N; x++) if (arr[x, y] < Z) { startx = x; starty = y; return; } } bool check(int x, int y) { if (x == N - 1 || y == N - 1 || x == 0 || y == 0) border = true; if (x < 0 || y < 0 || x >= N || y >= N) return false; if (arr[x, y] < Z) return true; return false; } void step(int x, int y) { bool ul = check(x - 1, y - 1); bool ur = check(x, y - 1); bool dl = check(x - 1, y); bool dr = check(x, y); prevStep = nextStep; int state = 0; if (ul) state |= 1; if (ur) state |= 2; if (dl) state |= 4; if (dr) state |= 8; switch (state) { case 1: nextStep = dir.Down; break; case 2: nextStep = dir.Right; break; case 3: nextStep = dir.Right; break; case 4: nextStep = dir.Left; break; case 5: nextStep = dir.Down; break; case 6: if (prevStep == dir.Down) { nextStep = dir.Left; } else { nextStep = dir.Right; } break; case 7: nextStep = dir.Right; break; case 8: nextStep = dir.Up; break; case 9: if (prevStep == dir.Right) { nextStep = dir.Down; } else { nextStep = dir.Up; } break; case 10: nextStep = dir.Up; break; case 11: nextStep = dir.Up; break; case 12: nextStep = dir.Left; break; case 13: nextStep = dir.Down; break; case 14: nextStep = dir.Left; break; default: nextStep = dir.None; break; } } Let us try again on our test function z = x 2 + y 2 :
As can be seen in the picture, the algorithm quite successfully coped and separated the points where the value of the function is higher than 5, but slightly to the right and higher. The isoline is angular, so we interpolate. The meaning of interpolation is that, based on the values of z in the adjacent grid nodes, we compute a closer value of x, or y, to the real contour, which makes the contour more plausible.
We will use the linear interpolation formula:
x = (Zf (x i-1 , y j ) / (f (x i , y j ) -f (x i-1 , y j )) + x i-1 ,
y = (Zf (x i , y j-1 ) / (f (x i , y j ) -f (x i , y j-1 )) + y j-1 ,
where Z is the value on which you want to isoline.
Interpolation on the x coordinate, or on the y coordinate, is selected depending on the direction of motion for the previous and next steps.
Let's write for this such not very good code:
... List<PointF> res; ... // x y int dx = 0, dy = 0; switch (prevStep) { case dir.Down: dy = 1; break; case dir.Left: dx = 1;break; case dir.Up: dy = -1; break; case dir.Right: dx = -1; break; default: break; } ... double X = x0 + x; double Y = y0 + y; if (ip) //ip - interpolation { // if (dx != 0 && prevStep == nextStep) Y = y0 + y + (Z - a[x, y - 1]) / (a[x, y] - a[x, y - 1]) - 1; if (dy != 0 && prevStep == nextStep) X = x0 + x + (Z - a[x - 1, y]) / (a[x, y] - a[x - 1, y]) - 1; // if (nextStep == dir.Down && prevStep == dir.Left) Y = y0 + y + (Z - a[x, y - 1]) / (a[x, y] - a[x, y - 1]) - 1; if (nextStep == dir.Left && prevStep == dir.Down) X = x0 + x + (Z - a[x - 1, y]) / (a[x, y] - a[x - 1, y]) - 1; if (nextStep == dir.Up && prevStep == dir.Right) X = x0 + x + (Z - a[x - 1, y]) / (a[x, y] - a[x - 1, y]) - 1; if (nextStep == dir.Up && prevStep == dir.Left) X = x0 + x + (Z - a[x - 1, y]) / (a[x, y] - a[x - 1, y]) - 1; if (nextStep == dir.Right && prevStep == dir.Up) Y = y0 + y + (Z - a[x, y - 1]) / (a[x, y] - a[x, y - 1]) - 1; if (nextStep == dir.Right && prevStep == dir.Down) X = x0 + x + (Z - a[x - 1, y]) / (a[x, y] - a[x - 1, y]) - 1; // "" if (!(nextStep == dir.Down && prevStep == dir.Right) && !(nextStep == dir.Left && prevStep == dir.Up)) res.Add(new PointF((float)X, (float)Y)); } ... And we get a result that suits us more:
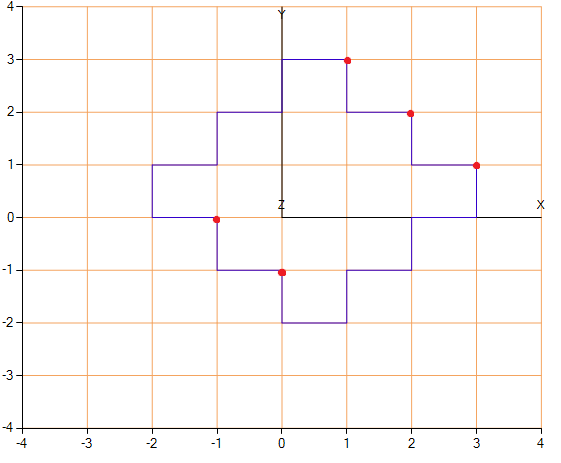
An example of "unnecessary points" that we have excluded.
Of the possible improvements, it should be noted that our implementation will build all isolines only for monotonically increasing (for decreasing ones, the sign should be changed to “>”) functions. For functions that periodically increase and decrease, it is necessary to change, for example, the function of finding the initial position and perform it several times.
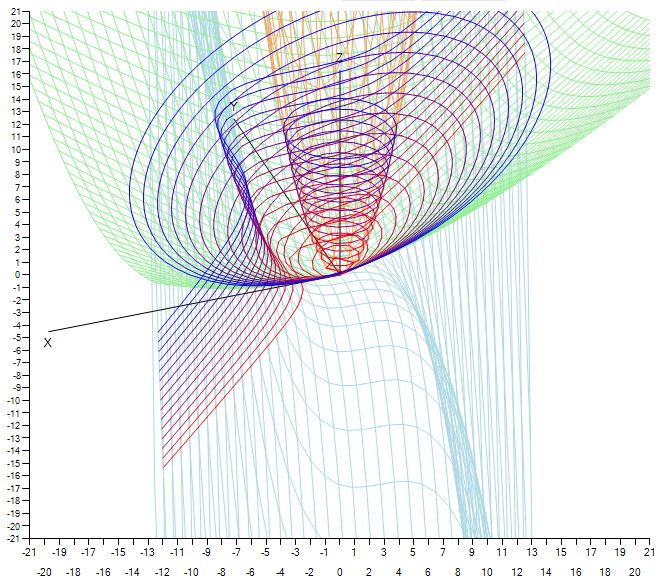
An example of the final program.
In practice, this can be used to analyze maps, or to search for the contour in the image.
')
The source code of the program can be downloaded here or here .
Once again the links that were used:
ru.wikipedia.org/wiki/Matrix_turn
ru.wikipedia.org/wiki/Ugly_Eyler
ru.wikipedia.org/wiki/ Interpolation
ru.wikipedia.org/wiki/Marching_squares
devblog.phillipspiess.com/2010/02/23/better-know-an-algorithm-1-marching-squares
Source: https://habr.com/ru/post/141881/
All Articles