How to plan performance tracking of e-commerce sites using Google Analytics
Translation of Justin Curtoni's article. Original: http://cutroni.com/blog/2012/02/09/pimping-out-google-analytics-for-ecommerce-websites/
Somehow I was asked how to set up Google Analytics for an e-commerce site. And before plunging into clarifying technical details, I wanted to talk about the basics of this process from a business point of view.
So, this post is about how I plan to track the effectiveness of electronic sales. Immediately make a reservation, e-commerce sites are different in size, some are more loaded, more advanced. This plan is good for medium-sized sites. We will talk about more complex e-commerce dimensions, such as net profit and cohorts, another time.
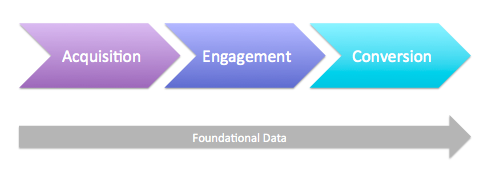
Analytical data on e-commerce can be divided into four categories, and for clarity, I created a small chart (after all, everyone likes charts):
')
Four types of data for analyzing e-commerce sites
For example, I will use the site REI . This is an e-commerce site that brings together a large number of online stores.
To increase sales on the site uses interesting and elegant tricks. I will also clarify the frequency of reporting in order to give an idea of how often I turn to this or that data. Frankly, this is a huge amount of information, and constantly monitor all this is impossible!
This section is entirely devoted to data on how and from where customers get to the site. Marketers need to know which campaigns work and which ones go unnoticed. There are many different types of campaigns, some of them aimed at disseminating information about the brand, while others urge the consumer to take specific actions. And approaches to measuring campaign performance may vary.
Given the above, tracking the performance of each campaign is critical . It allows you to work with different types of segmentation, and we have the opportunity to relate data on evaluating the effectiveness of campaigns with their goals.
While tracking the effectiveness of various campaigns, we can measure things like:
Reporting frequency: for marketers - daily. Less often - for the authorities.
Description of the process of user interaction with the site may be not an easy task. There are several key indicators, such as the Bounce Rate, which is very easy to understand. But I want more - to measure the whole process of consumer interaction with the online store. And if you look at a site like REI.com, then make sure that there are lots of different ways to do this.
These types of interactions are usually referred to as micro-conversions, as they do not generate revenue instantly, but they will probably bring in the future. Most of these activities are related to strengthening relationships with potential customers.
The "interaction" metrics include:
Newsletter subscriptions and store searches are also considered micro-credits.
[Do not worry, we will look at how to do all this, another time.]
Reporting frequency: to marketers - weekly. Less often - the authorities.
So we got to the essence of the business! Deal! It focuses, right? Every employee wants to see a profit. Fortunately, we can do it!
But it is necessary to measure not just profits, but many of the most important metrics associated with it. And that's how I see them:
Reporting frequency: I view it daily.
In addition to all the data related to the life cycle of the transaction itself, there is a lot of other information that can help us analyze business performance.
Reporting frequency: once in two weeks (for heavily loaded sites) or monthly.
Reporting frequency: depends on initiative.

After studying the information that people searched on the site, you can get a deeper understanding of the nature of users' behavior, their desires and motives.
The keywords that users drive into site search provide valuable information about what customers think about your products, for example, the terms they describe your products. If the search on the site did not lead to anything, it means that there is no demand product in the product line, or your search engine does not work. Anyway, curious information.
Reporting frequency: twice a week (for heavily loaded sites) or monthly.
This is my overall plan. The next article will have more tactical explanations on how to track all these things.
Somehow I was asked how to set up Google Analytics for an e-commerce site. And before plunging into clarifying technical details, I wanted to talk about the basics of this process from a business point of view.
So, this post is about how I plan to track the effectiveness of electronic sales. Immediately make a reservation, e-commerce sites are different in size, some are more loaded, more advanced. This plan is good for medium-sized sites. We will talk about more complex e-commerce dimensions, such as net profit and cohorts, another time.
Analytical data on e-commerce can be divided into four categories, and for clarity, I created a small chart (after all, everyone likes charts):
')
Four types of data for analyzing e-commerce sites
- Attraction: information about the traffic received,
- Interaction: information about what people do on the site,
- Conversion: liquidity information (profit, profit, profit ...),
- General: other universal data that we must check every now and then.
For example, I will use the site REI . This is an e-commerce site that brings together a large number of online stores.
To increase sales on the site uses interesting and elegant tricks. I will also clarify the frequency of reporting in order to give an idea of how often I turn to this or that data. Frankly, this is a huge amount of information, and constantly monitor all this is impossible!
Attraction
This section is entirely devoted to data on how and from where customers get to the site. Marketers need to know which campaigns work and which ones go unnoticed. There are many different types of campaigns, some of them aimed at disseminating information about the brand, while others urge the consumer to take specific actions. And approaches to measuring campaign performance may vary.
Given the above, tracking the performance of each campaign is critical . It allows you to work with different types of segmentation, and we have the opportunity to relate data on evaluating the effectiveness of campaigns with their goals.
While tracking the effectiveness of various campaigns, we can measure things like:
- marketing channels that generate the most revenue
- creative and promise that has the greatest response from consumers
- marketing activities, the most effective for attracting customers at the initial stage of purchase
- time of day when campaigns are most successful
Reporting frequency: for marketers - daily. Less often - for the authorities.
Interaction
Description of the process of user interaction with the site may be not an easy task. There are several key indicators, such as the Bounce Rate, which is very easy to understand. But I want more - to measure the whole process of consumer interaction with the online store. And if you look at a site like REI.com, then make sure that there are lots of different ways to do this.
These types of interactions are usually referred to as micro-conversions, as they do not generate revenue instantly, but they will probably bring in the future. Most of these activities are related to strengthening relationships with potential customers.
The "interaction" metrics include:
- Bounce Rate: We have been talking about it for many years! The Bounce Rate determines the percentage of visitors who viewed only one page and left the site immediately. This metric is not particularly useful in the scale of the site, but it is extremely curious in the framework of the advertising campaign.
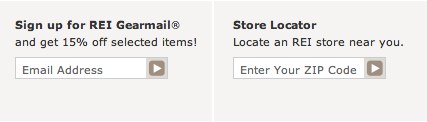
- Newsletter: E-mail newsletters are still very important! To encourage someone to subscribe to the newsletter is great.
- Search form nearest store: Very good metric. Many sites provide users with the opportunity to find the nearest store, look and personally explore the product. Measuring the number of times a shopping search button was activated will not say anything about sales, but will give you curious information. Especially if you analyze which points of sales were searched most often.
Newsletter subscriptions and store searches are also considered micro-credits.
- RSS Subscription: I love subscribers. Although we do not know for sure whether they read what we send, in any case, the subscriber is an interested person.
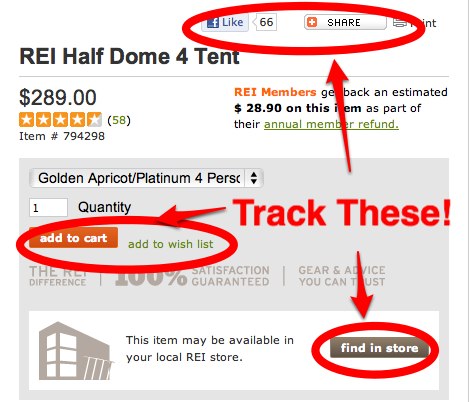
- Basket: This is an important part of the purchase process. Until you add to the basket, you will not buy it! And since this is such an important stage in the buying process, we will measure it.
- Wish list: This is a kind of predictor of the future! How many people add goods to the cherry lists, and how many - in the basket? And how many people actually make a purchase as a result? It is important to know the answers to all these questions. When we learn to measure it, we will actually get a forecast of future income from deferred goods.
- Blocks of social networks on the site: (tweets, likes, +1): Does someone click on these buttons? And what do we know about those who do this? This group is an important consumer segment.
- Product Information: many e-commerce sites have a ton of information that encourages consumers to make a purchase. This information is usually divided into various tags, as on the REI website. Tags also need to be monitored, it will provide an opportunity to collect data as searched for tags.
- Product rating: This is another great way to interact with customers. Interaction = familiarity = future earnings. Reviews can be not only an excellent source of traffic (hello to free SEO), they will also give a deeper understanding of what your customers like and what they don't.
- Product Video: I LOVE the product video. There is no better way to feel the product, unless you hold it in your hands. But this is not possible online. We need to be able to measure video! After all, not all videos are the same? If not, with which videos and how do consumers interact? So, if I have a site like REI, then I want to track the video.
- Attitude of views to orders: I learned about this metric from Brian Eisenberg at the Google + party, and she’s fantastic! Brian recommends measuring how many people view a product or category, but do not buy. Think how important it is. If people look at the product, but do not buy - there is some kind of hindrance. Just fix it!
[Do not worry, we will look at how to do all this, another time.]
Reporting frequency: to marketers - weekly. Less often - the authorities.
Conversion
So we got to the essence of the business! Deal! It focuses, right? Every employee wants to see a profit. Fortunately, we can do it!
But it is necessary to measure not just profits, but many of the most important metrics associated with it. And that's how I see them:
- Income: Well, what is there to explain! You sell and count your profits!
- Return on investment: ROI is a great metric, it helps us to understand how much money we earned on what we invested in. Cool, yeah? But not always Google Analytics allows you to track your ROI. With it, you can only assess the profitability of AdWords. Why is that? Because in Google Analytics there is no data about your investments. That is, if you spend $ 1,500 on a mailing list / marketing campaign, Google Analytics does not know anything about it. But this should not be an obstacle to assessing the profitability of your investments.
- Average order price: what is the average bill when you buy on the site? We often try to encourage customers to spend more money on a single transaction, using, for example, cross-selling. We can also use the average order cost indicator to identify the most cost-effective channels to attract visitors, for example, e-mail, search, or social networks.
- Profit from regular customers: Technically, this is segmentation, but I decided to add this metric to this list. Almost every business wants to have loyal customers. Why? It is required much less effort to constantly encourage a customer to make a purchase than it takes to attract a new one. It is very important to segment both groups and study their behavior.
- Profit per visit or value of one visit: The value of each visit is an excellent metric, because it makes it possible to compare the cost of traffic from different sources. And this is a great way to compare returns on investments in various traffic sources.
- The effectiveness of internal campaigns: many businesses promote certain products directly on their website. For example, they may hang on the main page an advertising banner with information on the elimination of seasonal goods. The ability to segment profit and calculate the effectiveness of such campaigns is extremely useful.
- Intentions of Visitors and Satisfaction: Here we have data from the category of "quality." Are the needs of those who come to your site satisfied? Have they successfully logged in? And moreover, it is important, for what purpose they went? You can not get the right answer based only on quality data. Quantitative data, usually from reviews, to help you.
Reporting frequency: I view it daily.
"General" metrics
In addition to all the data related to the life cycle of the transaction itself, there is a lot of other information that can help us analyze business performance.
- Time to purchase: It takes a week or maybe a month to take the consumer to the purchase? It is very important to understand this aspect in order to customize the marketing campaign for your customers.
- Visiting a website before purchasing: How many times does an average visitor visit a website before making a purchase?
- The behavior of valuable customers: How do valuable customers behave? By customer prices, I mean people who spend more than a certain amount of money. How do they find the site (where does geography come from, and with what marketing campaign)? Almost everything we talked about so far has a direct bearing on daily business management. But there is a whole world of metrics that help us evaluate the technical aspects of the site.
- The quality of the site: If the site is not fast enough, no one will linger on it. Seriously. Site performance metrics also affect earnings and must be monitored, though not every day.
- What is the average speed of loading a site page?
- In particular, which page loads the longest? How does this affect the bounce rate and profit?
- What are the most common site errors (404, etc.)?
- What are the technical parameters of the devices used by visitors (operating system, screen resolution) and how it affects the business.
Reporting frequency: once in two weeks (for heavily loaded sites) or monthly.
- Mobile phone applications: information about devices also applies to data on the work of the site, but there are still some differences. I usually consider mobile devices as a separate category, as the mobile field is developing very quickly. Not only do you need to check the operation of the website on a specific device, you also need to think about usability when using applications or a mobile site.
- What devices are most popular?
- What are the most popular device versions?
- Which media are most commonly used?
Reporting frequency: depends on initiative.
- Site Search: I have long been praising the value of site search, it’s just an amazing thing. Again, this is not the data set that I work with every day, but what I watch once or twice a week or monthly.
After studying the information that people searched on the site, you can get a deeper understanding of the nature of users' behavior, their desires and motives.
The keywords that users drive into site search provide valuable information about what customers think about your products, for example, the terms they describe your products. If the search on the site did not lead to anything, it means that there is no demand product in the product line, or your search engine does not work. Anyway, curious information.
Reporting frequency: twice a week (for heavily loaded sites) or monthly.
This is my overall plan. The next article will have more tactical explanations on how to track all these things.
Source: https://habr.com/ru/post/141472/
All Articles