Optimization for CPU: how to find a black cat in a dark room

Invalid operation method:
Divide the cat by zero,
after which it will become infinitely large,
so it will be impossible to miss it.
[Absurdopedia]
Trying to find a performance problem with relatively simple code, I remembered several absurd methods of solution, described in Absurdopedia , for the task of finding a black cat in a dark room. Oddly enough, the successive use of three methods, which can be found at the link: Pragmatism, the method of dichotomy and the method of spear, helped me a lot.
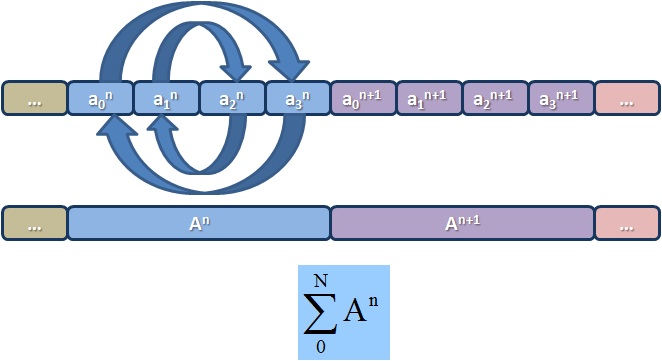
So, we have the task of sequentially swapping bytes in each word of the array (big-endian <-> little-endian) and summing all the words into one (reduction). Let us leave aside the task of parallelization for the time being, because its solution is close to the trivial one, and so far is of no interest to us.
')
Direct (in the forehead) implementation of the algorithm is usually called naive. This is probably due to the fact that we, programmers, naively rely on a compiler that will generate, if not optimal, then code close to this, and there will be nothing left to optimize. However, as we will see later in the disassembler, the compiler produces a fairly simple sequence of instructions, which, in theory, should not cause any special performance problems on the x86 platform.
void init() { int i; for (i = 0; i < 1024; i++) buf[i] = i; } unsigned int change_endianess(char *big) { char temp; temp = big[0]; big[0] = big[3]; big[3] = temp; temp = big[1]; big[1] = big[2]; big[2] = temp; return *(unsigned int *)big; } void reduce() { int i, n; unsigned int sum = 0; init(); for (n = 0; n < ITER_NUM; n++){//repeat itarations for (i = 0; i < 1024; i++){ sum += change_endianess((char *)(buf+i));}} printf ("Sum is %d\n", sum); } main () { reduce(); } As our witty marketers put it, “performance evaluation without profiling is a fortune telling.” Therefore, we run the General Exploration profile in VTune Amplifier XE in order to evaluate how effectively this code is executed on the Core i7 micro-architecture (codename Nehalem). Do not forget to specify the -Zi and / debug options: inline-debug-info for Intel Compiler (Windows) to save debugging information and information about function lines that were “inline” (how to say in Russian, “inlined”?) . The latter option is very useful, as it allows VTune Amplifier XE to attribute the values of the counters directly along the lines of the nested function. This is a new feature of VTune; it can also be turned off so that the results are displayed only opposite the function call.

Since the test runs fairly quickly (despite the choice of a sufficiently large number of iterations), it is useful to enable the Allow Multiple Runs option in the VTune project settings, which will cause the tool to run the test several times, collecting the counters in groups. Otherwise, the counters will be multiplexed, and accuracy may suffer if the test execution time is short.

From the results it is clear that nothing is clear. It can be seen that the performance of the execution of the code in the reduce function is quite far from perfect, since CPI = 1.67 is more than 6 times the optimal 0.25. No, this certainly does not mean that we have the potential to increase the code performance by 6 times, but it would be quite possible to achieve a lower CPI on such a simple cycle. However, why CPI is high is hard to say. The Retire Stalls metric is approximately equal to 0.7 and tells us that during the completion of the execution of instructions, there are downtime of the conveyor in 70% of cycles. The remaining performance indicators, judging by the results of the collected profile, are normal. Moreover, knowing that in most cases the memory subsystem is the cause of performance problems, you can specifically run Memory Access analysis. But he will show the same thing - there are no problems with memory. However, the code is so simple, and the access to memory is so consistent that it wasn’t even worth starting the memory analysis. For the same reasons, Branch Analysis will not help us.
We start looking for a black cat in a dark room, or rather the cause of a performance failure in the processor microarchitecture.
Apply the improved cat search method “Pragmatism”. Initially, it is necessary to decide what we will get if we find this cat, and whether we should look for it because of this. What exactly is our potential, help evaluate the metrics Execution Stalls and Retire Stalls .
The first mertika of Execution Stalls is the ratio between the values of the UOPS_EXECUTED.CORE_STALL_CYCLES counters and the UOPS_EXECUTED.CORE_ACTIVE_CYCLES counters .
The UOPS_EXECUTED.CORE_STALL_CYCLES event counter measures the number of idle cycles in the computational part of the processor pipeline when the Reservation Station does not assign operations to any port.
The UOPS_EXECUTED.CORE_ACTIVE_CYCLES event counter, respectively, counts cycles when at least one of the four computing ports and two read / write ports have a micro-op for execution.
The ratio UOPS_EXECUTED.CORE_STALL_CYCLES / (UOPS_EXECUTED.CORE_ACTIVE_CYCLES + UOPS_EXECUTED.CORE_STALL_CYCLES) will allow us to judge how much of the execution time of the function corresponded to the calculator's downtime, and our needs, we need, and we need to be a part of us, we need, and we need to be a part of us, we need to be a part of us, we need to be a part of us, we need to be a part of us, we need to be a part of us, and we need to be a one of us, we need to be a part of us.
By the way, the sum of these counters should give the value of the counter of all CPU_CLK_UNHALTED.THREAD cycles. And VTune uses the UOPS_EXECUTED.CORE_STALL_CYCLES / CPU_CLK_UNHALTED.THREAD ratio to automatically calculate the Execution Stalls metric.
In our case, the ratio is approximately equal to 0.24 (a quarter of the total number of idle cycles), and this means that if we eliminate the downtime, we can potentially increase the capacity of the calculator by at least a quarter - and this is only for one of the four slots.
The second metric of Retire Stalls is the ratio between the UOPS_RETIRED.STALL_CYCLES / CPU_CLK_UNHALTED.THREAD values , showing how much of the total number of cycles corresponds to the state when no micro-operations are completed (retired), although theoretically, it could complete up to 4 operations per clock.
This means that at 70% downtime, if we look good for a cat, eliminating the reason for waiting for the execution of operations, we can hope to speed up the program at least 2.3 times.
Using common sense, we conclude that for the sake of such acceleration of the implementation of the algorithm, you can and try.
To find where we have a problem, we use the second method of searching for the cat - “The method of dichotomy”: we successively divide the room into equal parts, or rather divide the stages of the processor's pipeline into logical parts, where you can try to find the cause of the problem. This method is well described in the Intel® 64 and IA-32 Architectures Optimization Reference Manual , in the “Using Performance Monitoring Events” section as “Performance Events Drill-Down and Software Tuning Feedback Loop”. Here is his somewhat simplified view:

The essence of the method is to successively separate parts of the conveyor, finding with the help of appropriate counters a place where it is simple, that is, unemployment by the promotion of micro-operations (bottleneck). Initially, it is necessary to determine whether microinstructions are executed in the pipeline. If so, does their execution end with success (Retire). In the case of performing operations that are not terminated by changing the state of the processor (Non-Retired), there is an erroneous prediction and execution of the wrong branch of the program (Bad Speculation). In our case, we are dealing with downtime of the pipeline, and then it is necessary to measure whether there are problems with the allocation of processor resources (internal registers, buffers, etc.). If not, it will mean that the processor lacks instructions for execution, and the problem in Frond-End, that is, where instructions are selected from the instruction cache, is decoded and queued for execution. If so, then the problem is somewhere in the darkest part of the room, called the Back-End, where calculations are made, and where there may be problems with the calculators themselves, as well as with micro-instrumentation scheduling, buffer allocation, waiting for data from the memory, and so on .
Determining whether Allocation Stalls is very simple. It is necessary to look at the meter reading RESOURCE_STALLS.ANY . Switching viewpoint VTune to Hardvare Event Count and looking at the readings of this counter (a value commensurate with the total number and CPU cycles), we understand that it is the lack of some resources, according to the counter, that can identify the problem in our code.
According to Absurdopedia, the method of dichotomy should lead to the division of the room until the cat concentrates to a point. However, for a processor microarchitecture, the possibilities of the method are not limitless and end at a certain stage. And here, as well as possible, the “At random method” is used - one of the most effective scientific methods, in cases where other, more rigorous and regular methods no longer help.
We need to re-measure all possible counters that diagnose a lack of resources. They are few, and you just need to replace the extension counter ANY, with specific resources. For my Core i7 mobile version: RESOURCE_STALLS.LOAD, RESOURCE_STALLS.STORE, RESOURCE_STALLS.ROB_FULL, RESOURCE_STALLS.RS_FULL, RESOURCE_STALLS.OTHER this data can be collected separately, or you can find it in the results of the General Exploration profile. The total figures hint to us that there is a problem in stopping the conveyor movement due to the filling of the ROB buffer, and the lack of a data recording buffer.

Store Buffer has data stored in memory. Delays in performing operations will be observed if there are a lot of write instructions that are interspersed with reading. Reorder Buffer (ROB) contains micro-operations that wait for the completion of the execution, as well as the operations that are performed, which change the state of the processor in the order of their execution (in-order). It is important to determine when waiting for what instruction the buffer was overflowed by incoming micro-operations and blocked further work of the conveyor.
This is where the Source View will help us, along with the Assembly View. To save space, we will arrange them separately, although they are nearby in VTune.

As can be seen from the value of the CPU_CLK_UNHALTED.TREAD counter, most of the ticks were in the cycle of performing the summation of words, and not on the permutation function. The data offset to the line of the for loop is somewhat confusing, but it always happens with cycles. Results related to the body of the cycle may shift to its title if the body of the cycle is small. To see this, look at the disassembled version of the function.

Basic Block 5 is interesting for us: it is a cycle of executing byte swapping and word summing operations - this is how the compiler generated instructions. Starting with the address 0x4010d0 to 0x401105, there are instructions for permuting the bytes in the word. At the address 0x40110s - just the sought instruction for summing the value of a word in the register edx. Again, due to the skid, the results are displayed on the inc instructions below, which may not take as many ticks. Interestingly, the same add add instruction collected the most readings from the Resource Stalls counters. Looking ahead and applying the same Metot at random, we note that by removing the cat from the room, that is, this summing operation, we will know for sure that the room is empty and the problems with Resource Stalls and performance have disappeared.
So what is the problem with this instruction, or rather with several micro-operations of which it consists (reading an address, reading data from memory and a summing operation in a register)? Here, as always, there is one trick: you must either be well aware of the features of the implementation of unloading-loading data in the micro-architecture, or use a slightly different microprocessor. Instead of our mobile Core i7 (code name Nehalem), we measure on a platform with a Xeon processor or on a processor with the codename Westmere (so to speak, take a room better equipped), in which you can additionally receive a counter LOAD_BLOCK.OVERLAP_STORE . It will just roll over the add asm instructions. In general, this counter signals blocked for various reasons micro-operations of data loading (load). The most common reason for such an alarm is that the load micro-op is blocked by the previous micro-op (store):
- Some bytes of read data were in a previous write operation, and some were not;
- The bytes of the read words are the same as for the previous record, and the word of the record is aligned in size, while reading 1-2 bytes of words not written at the beginning of the record, or 4-8 bytes, and not aligned with the records;
- The read word bytes are the same as for the previous record, but the word of the record is not aligned in size, and the reading is not aligned in the beginning of the word in the record.
Now let's take a closer look at the sequence of asm instructions that implement the cycle of permutation of bytes and summation. Here, nothing else happens than reading a word with the corresponding byte offset from memory to the ebx and ecx registers (time values) and byte writing data from the bottom of the bl and cl registers to memory. As long as we read and write by memory by memory, there are no problems. However, we should try to load the whole word from memory (load micro-operation in the add instruction) at the same address of the word as in the previous write operation, how this load operation will be blocked. The processor cannot transfer the entire word to the read buffer immediately after writing the word in parts - you have to wait. This problem is called Blocked Loads Due to No Store Forwarding. Remember it, as it will often occur if you are actively working with bytes inside words.
It should be noted that, investigating the problem on this mobile platform, I had to use the Modified At-A-Way Method, since the assembled counters did not explicitly indicate the presence of No Store Forwarding. We pulled the shrink-version of Nehalem - Westmere microarchitecture or Xeon here; and the General Exploration profile did not contain an event counter LOAD_BLOCK.OVERLAP_STORE. The next generation of processors — the 2nd generation Intel® Core ™ processor codenamed SandyBridge (actually the current generation) —contains a special LD_BLOCKS_STORE_FORWARD counter, which is in the VTune profile of General Exploration for SandyBridge, and which directly points us to the problem.
Now it remains to think about how to fix the code and solve the performance problem. From the description of the reasons for its occurrence, it is clear that it is necessary to do so that the loading of a word from memory does not immediately follow after its byte-writing to the same address. So, in order to avoid the tasks of searching for “this cat” in the future, you need to separate the room and the cat: we will carry out the operation of summing the words of the array into a separate cycle.
void reduce() { int i, n; unsigned int sum = 0; init(); for (n = 0; n < ITER_NUM; n++) { for (i = 0; i < 1024; i++) change_endianess((char *)(buf+i)); for (i = 0; i < 1024; i++) sum += buf [i]; } printf ("Sum is %d\n", sum); } The difference in program execution time can be seen by comparing the results of the profiling.

One small question remains: why did the function accelerate more than 3 times, whereas in the beginning we determined that idle cycles are only 70 percent? The fact is that such a number of cycles the processor is idle with this set of instructions used by the compiler. By separating the byte permutation and summation cycles in the source code, we helped the compiler to automatically vectorize the last cycle, and it replaced the usual scalar summation and read / write instructions with vector SIMD instructions, which are 4 times faster for int32 data on the 32-bit platform. . Remember the potential calculated by CPI?
Source: https://habr.com/ru/post/140965/
All Articles