How to measure the loyalty of site visitors?

Everyone knows what sites need to do for people. Everyone is already conducting usability testing, adding landing pages to J.Metrica and GAnalytics. In general, they consider something and decide on the results how to change the site.
I'll tell you about one more relative value that can be measured - the loyalty of your visitors. Or rather, the dynamics of its change.
What do I understand by the positive dynamics of loyalty?
This is a reduction in the number of visits and the total amount of time to reach a goal.
That is, ideally, at the first visit, the visitor should buy something from us, contact by phone or feedback form, download something, i.e. perform the action we need.
')
Why and in what cases it is necessary to measure this value? When we changed something for the convenience of people or placed information (not necessarily on your site), which is able to increase the authority of the site and the company.
This works under the condition that the share of new visitors is overwhelming, because the large core of regular users will make our measurements useless.
Ya.Metrika allows using 2 values for solving our problem:
- The number of visitor visits to achieve the goal
- The number of days that pass from the first visit to the goal
Those. Visitor loyalty should be improved in the case when it takes less repeated visits and less time from the first visit to reach the goal.
An example of loyalty of visitors to an online store (90% of new visitors)
This graph shows how the conversion of requests received from the site for the intervals of repeated visits varies:
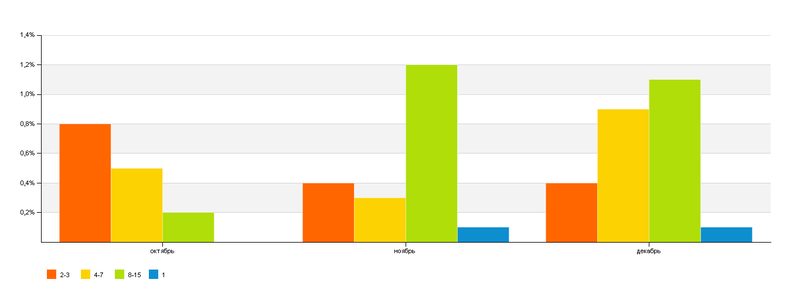
How to build a report in the constructor: Report on the month of the visit and the total number of visits of the visitor (interval); calculate the number of visits and the conversion for the “Completed Application” goal, provided that the total number of visitor visits (interval) is <16–31
Type of chart: x-axis - months, y-axis - conversion for the "Filled application" goal, color - total number of visits (interval).
Conclusion from the schedule:
- there were visitors who made an order for the first visit
- increased the proportion of people who make an order in 4-15 return to the site
- decreased percentage of people who make an order in 2-3 visit
This table shows whether the amount of time in days that a person needs to make a decision is reduced (for clarity, the target page “contacts” is selected):
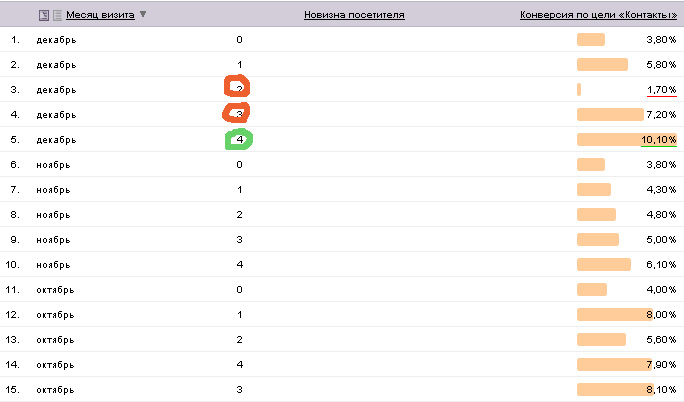
How to build a report: Report on the month of the visit and the newness of the visitor; calculate the conversion, provided that the visitor's novelty is <5 days
Conclusion from the table: a smaller percentage of people began to view the contact page in the first days of acquaintance with the site, which means that we did something wrong with the site.
PS Just in case: this is a very subjective assessment and you need to take into account all other parameters too. Such as:
- the total number of targeted actions (if it is very small, then the measurement error is very large),
- reduction of failures
- compliance with the geography of the audience,
- attendance dynamics and everything that is evaluated in all standard reports.
And most importantly, do not forget to record exactly what changes and when made to the site, otherwise you will not understand what led to the improvement / deterioration of the situation.
I would be happy for amendments and clarifications.
Source: https://habr.com/ru/post/140669/
All Articles