DirectX Debugging - Easy.
 Understanding the processes occurring "under the hood" DirectX has always been fraught with difficulties and forced to use additional tools, such as for example Pix. But progress does not stand still, many ideas and ready-made solutions are now embedded in Visual Studio 11 beta. This tool allows you to significantly simplify debugging DirectX applications and give the programmer the opportunity to thoroughly understand the processes that form the image. Now each pixel can be thoroughly studied, and the whole story of his life is obtained.
New debug mode
In the debugging menu of Visual Studio 11 beta, a new item has appeared - “Debug / Graphics” , and within the framework of this article I will explain the purpose of each item.
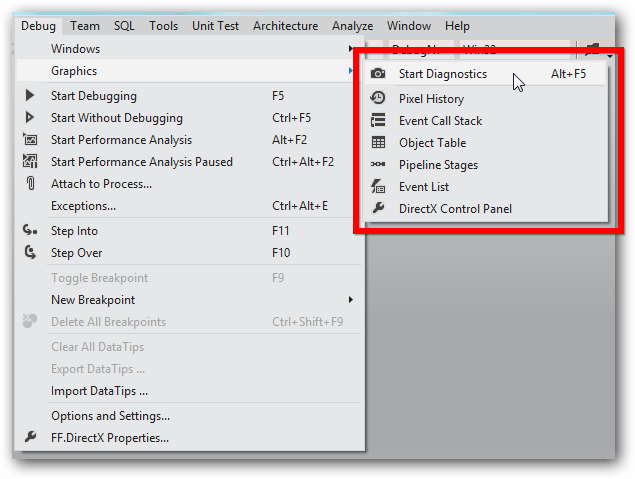
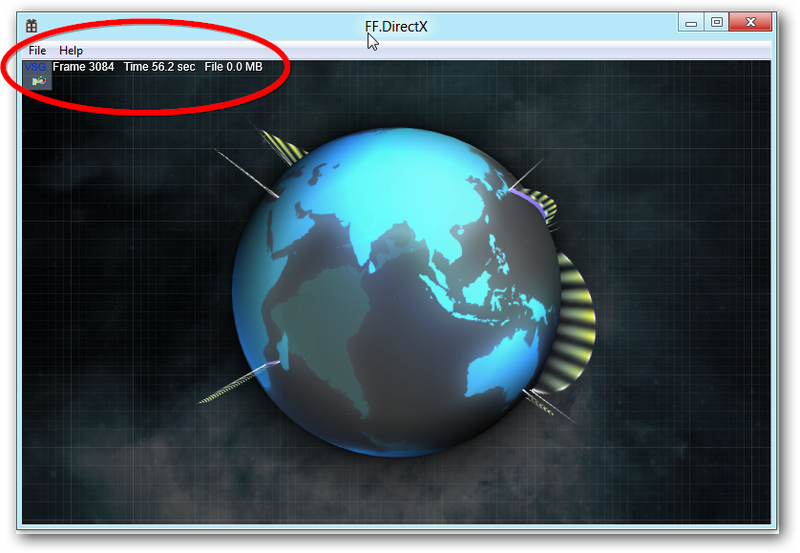
It all starts with the item "Start Diagnostics" . This is a special launch mode of your DirectX application, in which the debugging system allows you to take snapshots of current frames. As you can see, in the corner of the application, an overlay is visible in which the current number of rendered frames is displayed, the time from the start of the application launch, as well as the amount of memory occupied by snapshots.
')
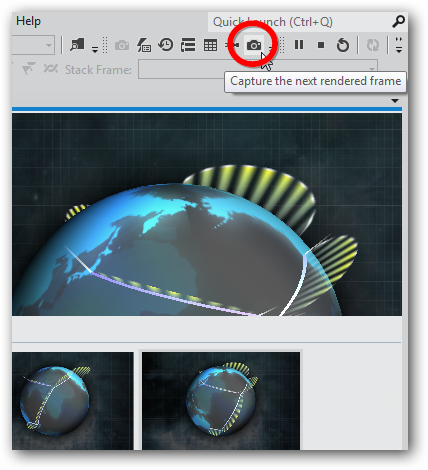
Pressing the “Print Screen” button generates a complete dump of the frame state, which includes the generated image, as well as a lot of additional information, which further allows you to understand what processes led to what we see on the screen, as well as what resources for this were required.
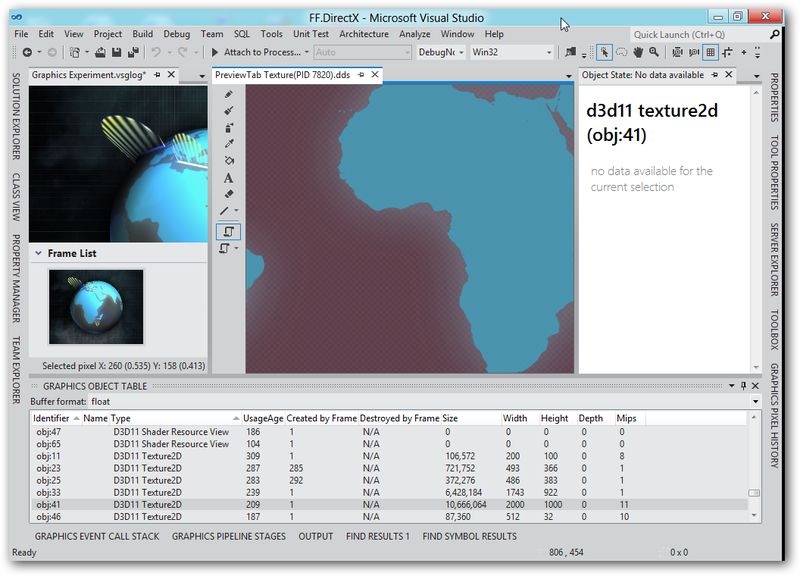
Calling the menu item “Debug / Graphics / Object Table” will help you figure out what resources are currently used to form this screen, how much memory they occupy, when they were created (in which frame), their resolution and many other information. Naturally, resources are not only textures, but also shaders, various buffers, states and views. This information will allow further optimization steps. For example, to be able to run your application on weaker hardware.
More details
The “Debug / Graphics / Pixel History” menu allows more detailed understanding of what was happening at the moment of image formation. In order to see the history of the formation of a particular pixel, it must be indicated by a crosshair. In the panel "Graphics Pixel History" will be presented the whole history of its creation.
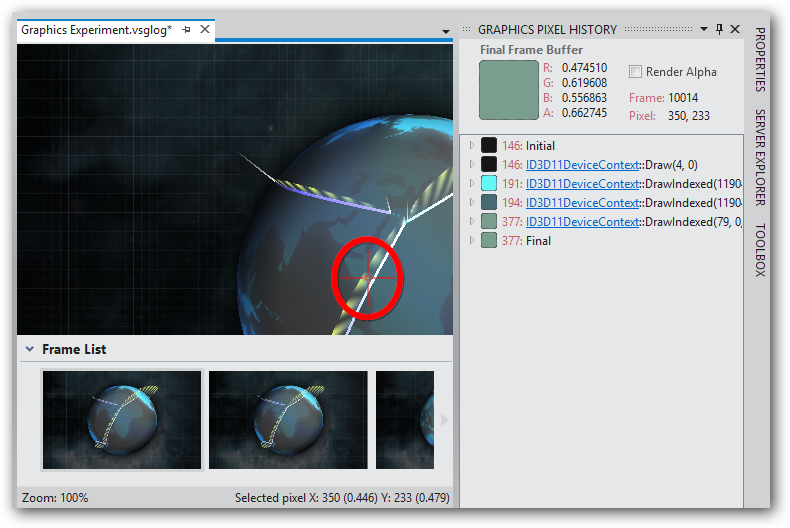
The four draw calls that are visible in the panel are actually drawing:
- Background
- Back of the globe
- Front of the globe with transparency
- Drawing rays reaching along the meridians
Each Draw method, in turn, interacts with the graphics subsystem pipeline, and thanks to the “Debug / Graphics / Pipeline Stages” menu item , you can see the details of this interaction.

Each of the four steps of the conveyor can be tested on phases
- Acceptance of the original geometry.
- Geometric transformations with vertex shaders, usually in order to set the proportions and turns of the object on the screen, the direction of the camera.
- Geometry processing by pixel shaders, actually coloring on the basis of any lighting model and textures.
- The final formation of the image with the combination of for example the previous steps of the render.
Back to the code
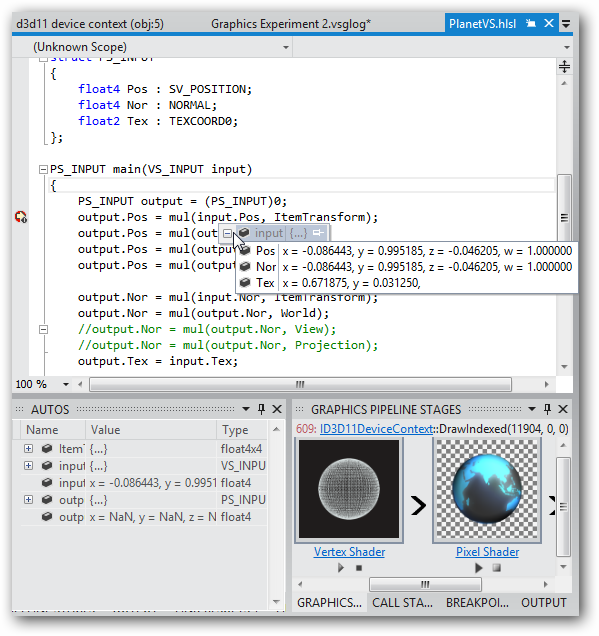
From the panel “Graphics Pixel History” it is also easy to get to the code that is executed by our application at each step. To do this, just use the “Debug / Graphics / Event Call Stack” menu item and select the source file that was responsible for this call, after which the source file will be positioned on the line that made the call.

In exactly the same way, by expanding the Draw call we are interested in, you can get the shader source code that handled this call in the pipeline. We do not forget that all the current diagnostics is now in front of us for a completely specific pixel, and we can even get the values of the variable innerColour for this frame, if desired. For those who are not familiar with DirectX, I will explain some details. The code that is presented on the screen is the HLSL firmware which, after compilation, is executed for each pixel of the image by the graphics accelerator. These firmware may have parameters, one of which is highlighted in blue.

The full state of the DirectX subsystem at the time of the Draw call for our pixel can be obtained as a report by clicking on the calls in the "Graphics Pixel History" panel. The report is very voluminous.
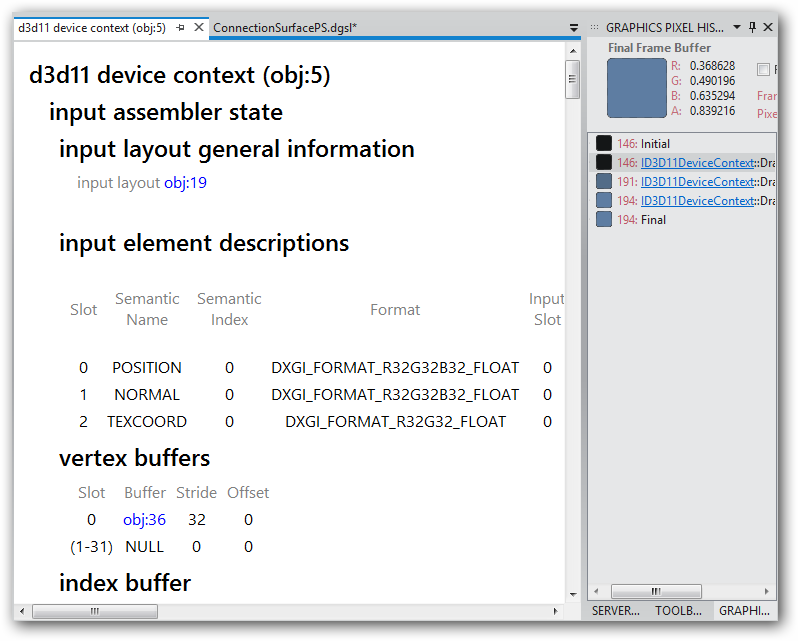
Having found in the report information about the state of the pixel shader, you can get data about the buffer of constants used for parameterization.
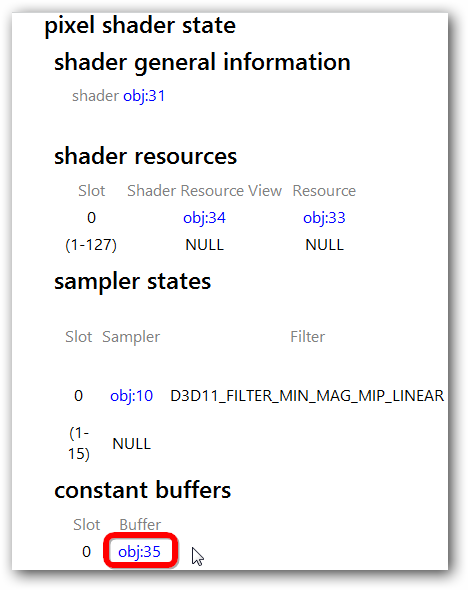
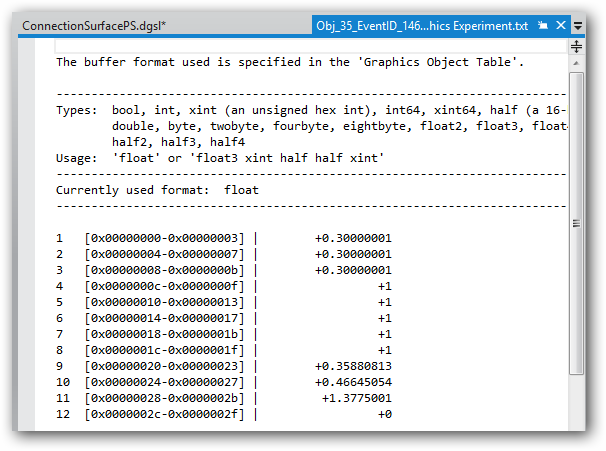
By clicking on the link obj: 35 you can see the status of this buffer. The values of the first four cells of which are the color (R, G, B, Alpha) of the input parameter innerColour.
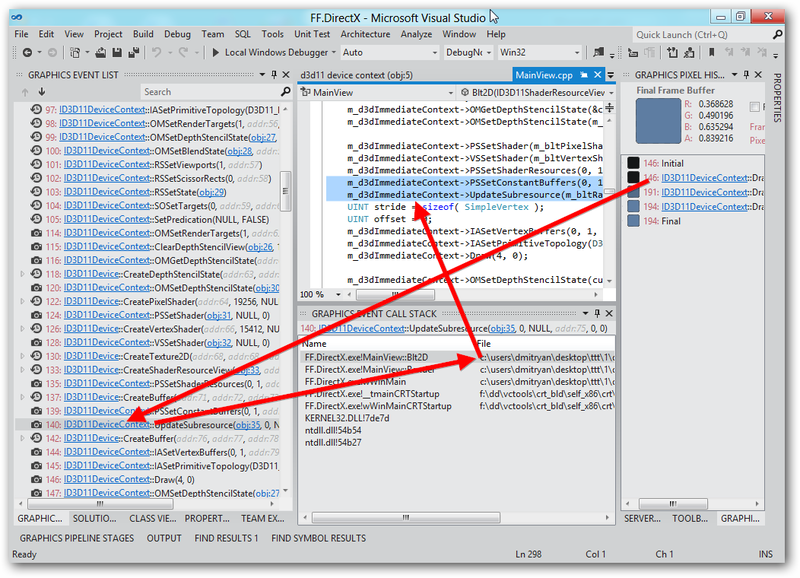
But this is certainly not all. In the future, it is possible to get to the source code of the program that generated these values (0.3 0.3 0.3 1.0). To do this, you can use the menu item "Debug / Graphics / Event List" . Selecting the Draw call we are interested in in the Graphics Pixel History panel, in the Graphics Event List panel we get the full list of DirectX API calls and look for the updateSubResource method for updating the shader parameters. A suggestion that this is the method that interests us is also a reference to obj: 35. And then using the panel "Graphics Call Stack" we find ourselves in a particular place in our program where this call was realized.
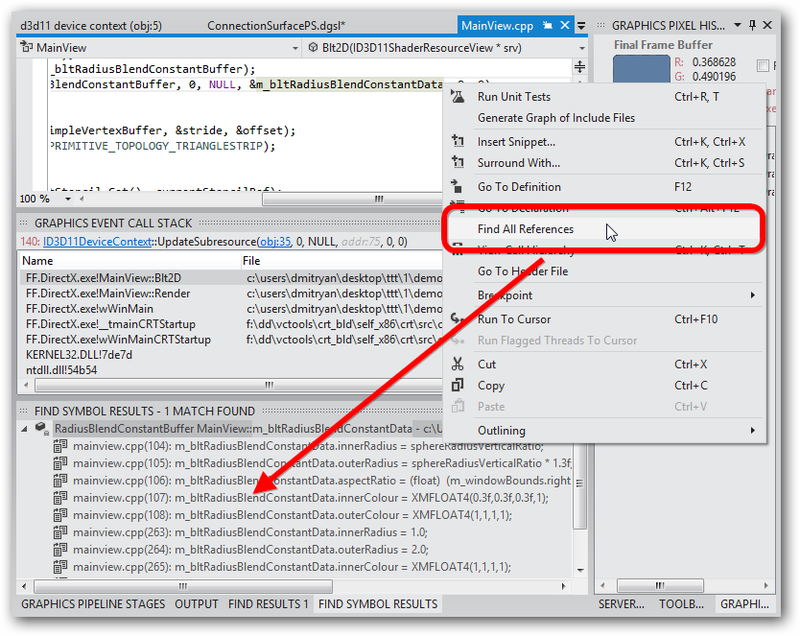
Now it is enough to use the usual menu item “Find All References” to find the line with the task of the parameters that interested us.
Shader Debugging
Debugging HLSL shaders is also not something extraordinary for Visual Studio 11 beta. To do this, it is sufficient to enable the creation of debug information for the shader source file.
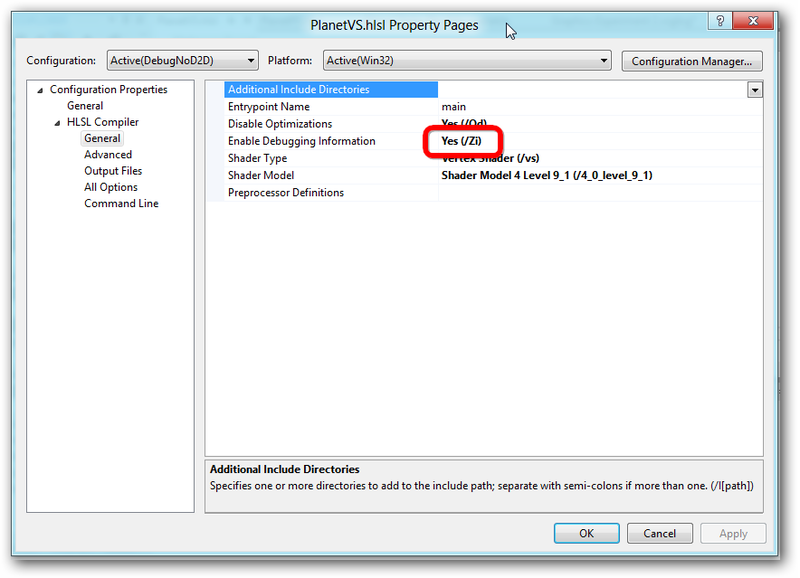
It remains only to arrange the breakpoints in the usual for Visual Studio mode and with the same features (for example, Condition break points). When a shader function containing a breakpoint is called, an interrupt will occur and it will be possible to examine the current values of the variables.
Conclusion
As it became clear from the article, debugging DirectX applications can be greatly simplified thanks to the tools included in Visual Studio 11 beta.
Let me remind you that you can download Visual Studio 11 beta right now at www.microsoft.com/visualstudio/ru-ru
Source: https://habr.com/ru/post/140638/
All Articles