Recommended Systems: SVD and Basic Predictors
Last time I talked, while in the most general terms, about singular decomposition - the main tool of modern collaborative filtering. However, last time we mostly talked only about general mathematical facts: that SVD is a very cool thing that gives good low-rank approximations. Today we will continue the conversation about SVD and discuss how, in fact, use all this mathematics in practice.

And we will start from afar again: let's look at what the rating of one product will be made of. First, it may well be that the user is kind and gives everyone good ratings in a row; or, conversely, evil and rating clamps. If you do not take into account this basic factor, it will not work - without adjusting for the average, the ratings of different users cannot be compared. On the other hand, some products are simply better than others (or at least promoted better), and this should also be taken into account in the same way.
Therefore, we will start by introducing the so-called baseline predictors (baseline predictors) that are made up of the basic predictors of individual users
  and basic predictors of individual products
  , and also just the general average rating on base μ :
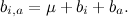
If we want to find only basic predictors, we will have to find such μ , and for which best approximate available ratings.
')
Then you can add the actual factors - now that we have made an amendment to the basic predictors, the residuals will be comparable with each other, and you can hope to get reasonable factors:
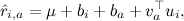
Where - a vector of factors representing product a , and
  Is a factor vector representing user i .
It may seem that finding, for example, basic predictors is a very simple matter: let's just calculate the average rating for the entire base. , we take it for μ , then we subtract it from each rating and calculate the average ratings
  by users and
  by products. However, it would be wrong to consider these predictors in this way: in fact, they depend on each other, and they should be optimized together.
Now we can return to the original problem and formulate it exactly: we need to find the best predictors that approximate
What does "best" mean here? The first approximation to the answer to this question is: the “best” are those who make the least mistakes on the available data. How to determine the error? You can, for example, add the squares of deviations (by the way, why squares? We will also talk about this in the next series) for those ratings that we already know:

And how to minimize such a function? It is very simple - by a gradient descent: we take the partial derivatives for each argument and move in the direction opposite to the direction of these partial derivatives. The error function is a quadratic surface, so no surprises await us here.
However, if we now write out and implement formulas for the gradient descent on the resulting error function L , the practical result on real datasets is unlikely to please us. In order to teach the good values of predictors and factors, we, generally speaking, would like to understand other important concepts of machine learning — overfitting and regularization , and we will see this in practice in one of the following series. In the meantime, just believe that you still need to penalize for too large values of the learning variables; for example, you can simply add the sum of squares of all factors and predictors to the error function.
As a result, the error function looks like

where λ is a regularization parameter.
If we take the partial derivatives of each of the variables to be optimized, we obtain simple rules for the (stochastic) gradient descent:

for all j , where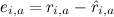 - error on this test example, and γ - learning speed. This model is called SVD ++, and it was she who formed the basis of the winning model in the Netflix Prize (although, of course, she could not win alone - why and what to do, we'll also talk later).
Next time I will try to analyze a specific example: apply SVD to the preference matrix, analyze what happens, highlight the main difficulties. I hope it will be interesting!
And we will start from afar again: let's look at what the rating of one product will be made of. First, it may well be that the user is kind and gives everyone good ratings in a row; or, conversely, evil and rating clamps. If you do not take into account this basic factor, it will not work - without adjusting for the average, the ratings of different users cannot be compared. On the other hand, some products are simply better than others (or at least promoted better), and this should also be taken into account in the same way.
Therefore, we will start by introducing the so-called baseline predictors (baseline predictors)
that are made up of the basic predictors of individual users and basic predictors of individual products , and also just the general average rating on base μ :If we want to find only basic predictors, we will have to find such μ ,
and for which best approximate available ratings.')
Then you can add the actual factors - now that we have made an amendment to the basic predictors, the residuals will be comparable with each other, and you can hope to get reasonable factors:
Where
- a vector of factors representing product a , and Is a factor vector representing user i .It may seem that finding, for example, basic predictors is a very simple matter: let's just calculate the average rating for the entire base.
, we take it for μ , then we subtract it from each rating and calculate the average ratings by users and by products. However, it would be wrong to consider these predictors in this way: in fact, they depend on each other, and they should be optimized together.Now we can return to the original problem and formulate it exactly: we need to find the best predictors that approximate
What does "best" mean here? The first approximation to the answer to this question is: the “best” are those who make the least mistakes on the available data. How to determine the error? You can, for example, add the squares of deviations (by the way, why squares? We will also talk about this in the next series) for those ratings that we already know:
And how to minimize such a function? It is very simple - by a gradient descent: we take the partial derivatives for each argument and move in the direction opposite to the direction of these partial derivatives. The error function is a quadratic surface, so no surprises await us here.
However, if we now write out and implement formulas for the gradient descent on the resulting error function L , the practical result on real datasets is unlikely to please us. In order to teach the good values of predictors and factors, we, generally speaking, would like to understand other important concepts of machine learning — overfitting and regularization , and we will see this in practice in one of the following series. In the meantime, just believe that you still need to penalize for too large values of the learning variables; for example, you can simply add the sum of squares of all factors and predictors to the error function.
As a result, the error function looks like
where λ is a regularization parameter.
If we take the partial derivatives of each of the variables to be optimized, we obtain simple rules for the (stochastic) gradient descent:
for all j , where
- error on this test example, and γ - learning speed. This model is called SVD ++, and it was she who formed the basis of the winning model in the Netflix Prize (although, of course, she could not win alone - why and what to do, we'll also talk later).Next time I will try to analyze a specific example: apply SVD to the preference matrix, analyze what happens, highlight the main difficulties. I hope it will be interesting!
Source: https://habr.com/ru/post/140555/
All Articles