Forecasting currency fluctuations by statistical methods
How it all began
Mastering a new direction in programming (programming for the MetaTrader platform), I got the idea to try my hand at something more. For example, to find some non-standard way of forecasting price movements for currency pairs.
Initially, attempts were made to implement the library with all the statistical indicators, but halfway through, I found that those already exist:
After analyzing their contents, I realized one simple thing ...
All functions described and implemented in the above source are the basis of standard trade indicators .
For reference
A trading indicator is primarily an economic-mathematical model that appears in a convenient form, most often in the form of lines on or under the chart. It is drawn in the wake of price changes or other market data.')
All of them take statistics and mathematics as a basis, namely: approximation and interpolation, calculation of average values of various orders, calculation of distribution histograms, etc. The data of such indicators are based on price readings depending on time.
The number of formulas just inspired! The idea seemed almost unreal, therefore I decided to put aside mate. calculations and use a template approach .
How it was
First step (failure)
Having tried to follow the example of indicators, I tried to analyze the price programmatically throughout the historical period of time. Based on the size of the bar, its volume and direction:

The result was zero! Analyzing only the characteristics of the bar, it is almost impossible to predict the further behavior of the trend.
Second step (failure)
Next, attempts were made to find some "templates" consisting of several bars. That is, now, the concept of a template was taken as a basis, or as I call it - a mask . Also, a new concept was introduced - mask length .
Having built a “pyramid” of nested loops, I launched the first pass through the whole story in search of similar masks with a length of 6 bars. The result shocked me! The program has not found anything in the last 12 years! Matches - 0! What's wrong?
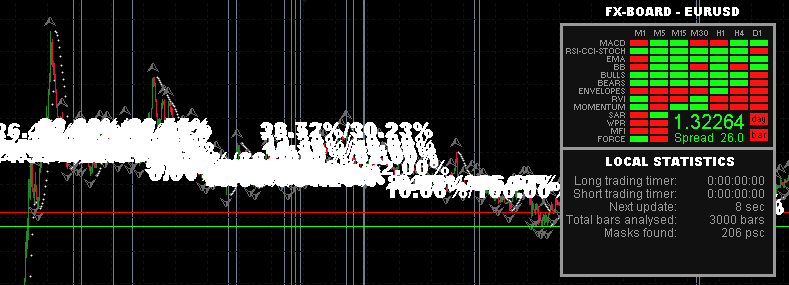
After several hours of finishing the algorithm, it turned out that it was not the case. It's all about the accuracy of the calculations. Indeed, it is almost impossible to find identical masks of such length. Without hesitation, I add an external parameter - the maximum accuracy of calculations . We try to test again, only with a mask of 3 bars and a maximum accuracy of 90 percent. The result is shocking again. 206 masks found, and they are located one on one:
Attempts to change the length of the mask or the accuracy always led to a zero result, then to a “heap” of masks, in which practically nothing can be disassembled, what to say about prediction. And failure again.
The third step is a welcome clarification.
After two absolutely failed attempts to realize the “my dream” indicator, which, based on statistics, will be able to answer the question “What will happen tomorrow?”, I have abstracted myself and decided to totally change the algorithm for working with the trend.
I left behind the idea of direct price analysis, and hooked up the mat. the device, or rather its implementation - trading indicators .
In fact, if you think logically, indicators comprehensively describe the state of the market . This statement can not even argue, it is clear. Immersed in the question, it emerges from it that the more heterogeneous indicators we use, the more accurate our description of the current state of the trend.
And then came the turning point! We can get not only the values of the price, according to historical data, but also so, without difficulty, we are able to calculate the state of the trend at any time in history.
Only the technical part of the question remains.
What ended
As a result of the “third step”, an algorithm was developed to analyze the current state of the trend and search for pattern situations in history.
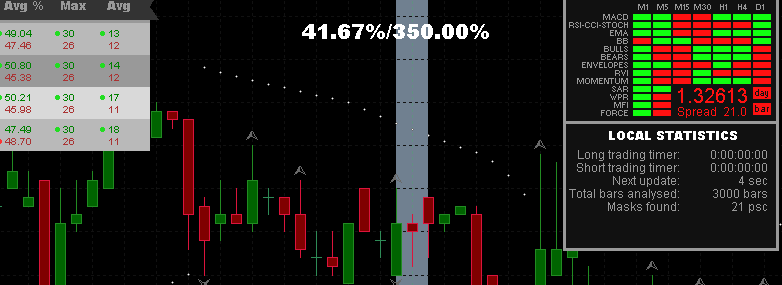
On the screen, an example of the program, namely - one of the masks found. It is characterized by two indicators:
1. accuracy , which is calculated by the formulas for calculating the correlation coefficient but with small adjustments to the range of output data (leaving only values> 0, because <0 is already a completely opposite trend);
2. the ratio of volatilities , I calculate this indicator based on the height of the current and found masks, so I get the values in percent> 0.
In addition to these indicators, various types of dispersion, linear and standard deviations, rank correlation, concordance, etc. were taken into account, but they were not used in the calculation of the forecast, because already indirectly embedded in it, in the form of trade indicators (with or without approximation). To make it easier to understand the logic, take a look at the diagram:
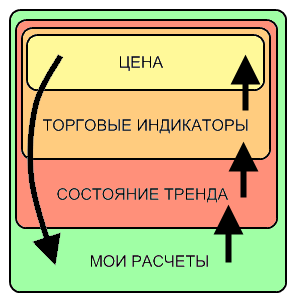
1. The price forms and provides the broker;
2. Indicators, reading the price values, give out statistical values (in the form of lines or histograms on the chart). All of them have open source code and are available by default in any trading terminal;
3. The state of the trend is calculated based on the values of many standard indicators (their list is clearly visible in the screenshots, on the right in the table). The calculation of each indicator allows you to simplify the trend direction analysis scheme: up is a green (1) rectangle, down is a red (0). Combinations of such units and zeros (78 signs) I call the state of the trend ;
4. My calculations are based on a simple analysis of the above states. After obtaining data on price and time, I just look at the future behavior of the market and calculate their total values, volatility and arithmetic average.
As you can see - nothing complicated.
This program successfully showed a good public forecast at the competition of ideas from 03.15.2012 . When following the guidance of this forecast, there was an opportunity to earn more than 1500 points for February 15-16, 2012. At the moment, there are massive improvements and code optimization (because the calculations turned out to be very heavy), and soon, I will post it for everyone to see.
findings
Having stepped on a bunch of rakes, now with confidence, I can give a couple of tips to novice traders / researchers / programmers:
1. Do not attempt to analyze specific price values.
2. Price is a function of demand, supply and brokerage gimmicks.
3. Try to approach the study of forecasting issues by the trader, broker and programmer.
Successful predictions to you!
Basement
1. A brief definition of indicators taken from the site: http://infofx.ru/
2. Source code links lead to solutions of people unknown to me. But I can assure you, these sorts are not capable of harming your computer, because These are files in plain text format.
3. Unfortunately, zero karma does not allow writing to Finance. Adapted topic for this hub. As soon as I can - I will transfer it.
4. I am open to discuss this issue. I will be glad to any comment or addition.
Source: https://habr.com/ru/post/140391/
All Articles