Fiddler - JavaScript debugging helper
On Habré, this tool has been mentioned, but somehow in the context of other topics.
So Fiddler is a proxy that works with traffic between your computer and a remote server, and allows you to view and change it.
- application first :
Actually, since this is a proxy, we can see all the requests, their headers, cookies, and the parameters transmitted to the server.
Once, I was often asked by back-end developers - how can I see the parameters passed to the server when sending a form. Then, through the console, firebug uploaded onsubmit to the form, did serialize, and sent the form, if necessary, to the Ajax. Now knowing about fidler - it is possible not to fence crutches.
In addition, by pressing F11, we can debug queries by adding the necessary parameters before sending to the server and substituting other responses from the server.

- replacement of extensions for FF :
There is a remarkable extension in FF for testing a site on a slow connection (the name of which I always forget) . In addition, "he" has a small flaw - I can not check the site in other browsers except FF.
To the rescue hurries:
- autoResponder + firebug
What I use most often and what I wanted to share the most.
Situation - you have a link to a live site in which you need to add / correct / debug a script.
 - Common situation?
What to do? Chef all gone, I can not work in such conditions!
Calm
Do it once:
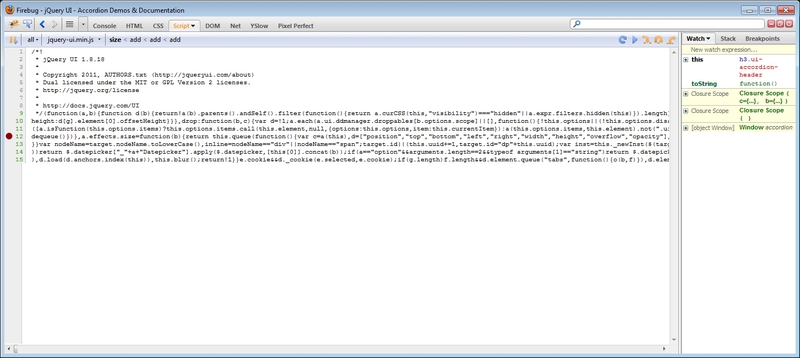
Save the script on your machine. And open in the editor.
Do two: we bring the code to a readable form, for example, using this service , and save the resulting one by replacing the obfuscated code.
Do three:
 - create a rule in AutoResponder. Now if we update our page in the browser, and the script that we’ve been debugging will have a digestible look -
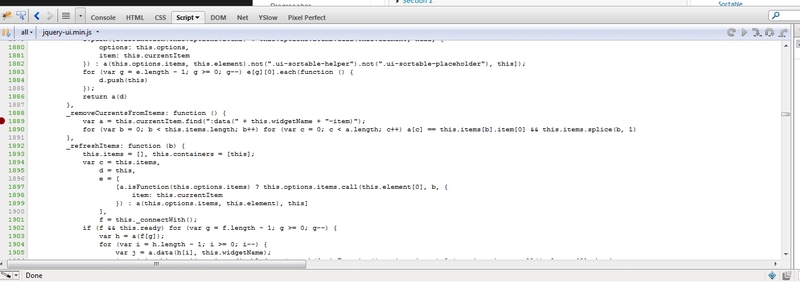
Now, every time you refresh the page, your local file will be replaced and given away. There is no need to save the page to the machine to add or debug functionality.
PS Based on this article, I found out about the parameter passed in the HTTP header " X-Requested-With XMLHttpRequest ", which is really present and visible among the request headers in Fidler, and now, on the basis of this question on stackoverflow, we now know how to get rid of it. Fuh, my javascript-bots for online games are safe;)
PPS Alternative for Fidler on linux - plugin for FF - Live HTTP Headers - however not so convenient.
More options , but unfortunately so far it was not possible to check the functionality of the proposed applications.
Links to read:
Overview of free tools for pentest web-resources and not only v2
Video by Feddler (eng.) - the video is quite old, judging by the interface.
HTTP Debugging Tools by I. Cantor
Fiddler presentation
Fiddler FAQ on stackoverflow
UPD:
MSDN - Fiddler PowerToy - Part 1: HTTP Debugging
MSDN - Fiddler PowerToy - Part 2: HTTP Performance
What is Fiddler ?
Fiddler is a Web Debugging Proxy which logs all HTTP (S) traffic between your computer and the Internet. Fiddler allows you to inspect traffic, set breakpoints, and “fiddle” with incoming or outgoing data. It can be extended using any .NET language.
Fiddler is a proxy, including Internet Explorer, Google Chrome, Apple Safari, Mozilla Firefox, Opera, and thousands. You can also use Windows Phone, iPod / iPad, and others.
')
To debug applications have been written in Java, .NET, or using WinHTTP, see this page .
So Fiddler is a proxy that works with traffic between your computer and a remote server, and allows you to view and change it.
- application first :
Actually, since this is a proxy, we can see all the requests, their headers, cookies, and the parameters transmitted to the server.
Once, I was often asked by back-end developers - how can I see the parameters passed to the server when sending a form. Then, through the console, firebug uploaded onsubmit to the form, did serialize, and sent the form, if necessary, to the Ajax. Now knowing about fidler - it is possible not to fence crutches.
In addition, by pressing F11, we can debug queries by adding the necessary parameters before sending to the server and substituting other responses from the server.
- replacement of extensions for FF :
There is a remarkable extension in FF for testing a site on a slow connection (the name of which I always forget) . In addition, "he" has a small flaw - I can not check the site in other browsers except FF.
To the rescue hurries:
- autoResponder + firebug
What I use most often and what I wanted to share the most.
Situation - you have a link to a live site in which you need to add / correct / debug a script.
- Common situation?What to do? Chef all gone, I can not work in such conditions!
Calm
Do it once:
Save the script on your machine. And open in the editor.
Do two: we bring the code to a readable form, for example, using this service , and save the resulting one by replacing the obfuscated code.
Do three:
- create a rule in AutoResponder. Now if we update our page in the browser, and the script that we’ve been debugging will have a digestible look - Now, every time you refresh the page, your local file will be replaced and given away. There is no need to save the page to the machine to add or debug functionality.
PS Based on this article, I found out about the parameter passed in the HTTP header " X-Requested-With XMLHttpRequest ", which is really present and visible among the request headers in Fidler, and now, on the basis of this question on stackoverflow, we now know how to get rid of it. Fuh, my javascript-bots for online games are safe;)
PPS Alternative for Fidler on linux - plugin for FF - Live HTTP Headers - however not so convenient.
More options , but unfortunately so far it was not possible to check the functionality of the proposed applications.
Links to read:
Overview of free tools for pentest web-resources and not only v2
Video by Feddler (eng.) - the video is quite old, judging by the interface.
HTTP Debugging Tools by I. Cantor
Fiddler presentation
Fiddler FAQ on stackoverflow
UPD:
MSDN - Fiddler PowerToy - Part 1: HTTP Debugging
MSDN - Fiddler PowerToy - Part 2: HTTP Performance
Source: https://habr.com/ru/post/140147/
All Articles