Analyzing Twitter with R
Hello, dear habrasoobschestvu!
On Habré, we have already spoken several times about the possibilities of the R environment, but I think that additional information will become useful, since R is a very interesting and powerful tool that can be applied in various areas. I will try to prove it with an example of analyzing the appearance of one of the trends of Twitter. To do this, we need the twitteR library, which allows you to work with Twitter through the API. But first I will tell you more about R.
The system of statistical data processing and programming R is focused on the use of the command line interface. Data processing in the R system is a sequence of commands for loading source data, calculations and textual or graphical output of the obtained results. Such a sequence can be generated by the user either using the command line (interactive mode) or from a text file (batch mode), and textual or graphical results of calculations can be displayed on the screen and / or recorded in the corresponding files.
For a user familiar with the graphical interface, this approach may seem inconvenient and outdated, but, fortunately, this is just a common misconception. After working out the basic skills, the efficiency of data processing using the keyboard and the command line interface is not lower, but higher than with the mouse and graphical interface. One of the reasons is that it is extremely difficult, if not impossible, to put in the menu and icons hundreds of functions used in statistical analysis, and the command line R accepts any combination of functions that is correct from the interpreter's point of view [1].
')
R provides ample opportunities that can be demonstrated on the example of analyzing the moods of users of the social network Twitter.
Late at night on February 26, information about the tragic death of the famous British actor Rowan Atkinson began to spread among users. This fact was not confirmed, but the number of messages increased, and the news of the death of the actor who played Mr. Bean rather quickly became a Twitter trend. Reports of the death of the actor contained the phrase RIP Rowan Atkinson. Using the capabilities of R, you can analyze the event in question and visualize the stages of information dissemination.
The analyzed data is a text array containing information about the sender, date, time and message text.
Data obtained as follows:
Using the data obtained, it is possible to visualize the process of creating an information flow and track the time when users were most active.
Figure 1 displays the number of messages generated by users by day. According to the presented schedule, you can trace the appearance of the first message, the increase in the number of messages and the achievement of its peak in the first half of the day. Further, there is a gradual decline and extinction of user interest in this topic.

Figure 1. The number of messages per day
The schedule is as follows:
Figure 2 shows the distribution of sent messages by the hour. The graph shows that the first messages began to appear after 20 hours on February 26th, and the largest number of messages fell on the morning of February 27th.
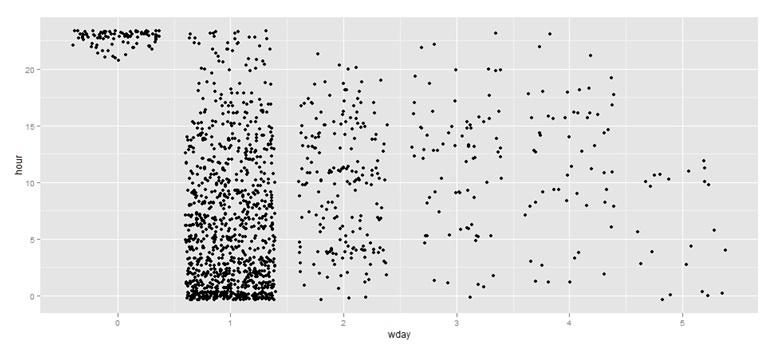
Figure 2. Distribution of sent messages by the hour
The schedule is as follows:
Figure 3 shows the cloud of the most common words in user messages.
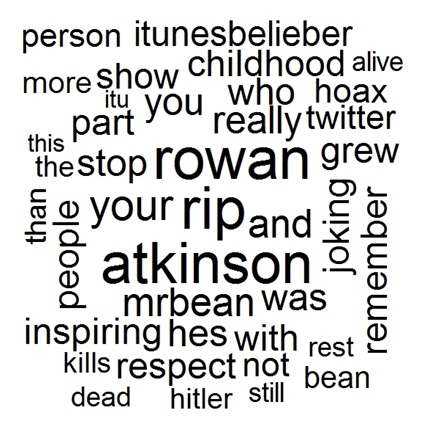
Figure 3. The cloud of the most common words in messages
The schedule is as follows:
The given example shows how wide the possibilities of R. Already on such a small sample of data is, it is possible to analyze the social aspects of the dissemination of information and highlight some patterns using the graphs created in R.
Currently, implementations of R exist for the three most common families of operating systems: GNU / Linux, Apple Mac OS X, and Microsoft Windows. As of the end of September 2010, in the distributed repositories of the CRAN system, 2548 expansion packs were available for free, focused on specific data processing problems arising in econometrics and financial analysis, genetics and molecular biology, ecology and geology, medicine and pharmaceuticals and many others application areas. A significant part of European and American universities in recent years have been actively switching to the use of R in educational and research activities instead of expensive commercial developments [1].
1. Statistical analysis of data in the system R. Tutorial / A.G. Bukhovets, P.V. Moskalev, V.P. Bogatova, T.Ya. Biryuchinskaya; Ed. prof. Bukhovtsa A.G.-Voronezh: VSAU, 2010. - 124s.
On Habré, we have already spoken several times about the possibilities of the R environment, but I think that additional information will become useful, since R is a very interesting and powerful tool that can be applied in various areas. I will try to prove it with an example of analyzing the appearance of one of the trends of Twitter. To do this, we need the twitteR library, which allows you to work with Twitter through the API. But first I will tell you more about R.
The system of statistical data processing and programming R is focused on the use of the command line interface. Data processing in the R system is a sequence of commands for loading source data, calculations and textual or graphical output of the obtained results. Such a sequence can be generated by the user either using the command line (interactive mode) or from a text file (batch mode), and textual or graphical results of calculations can be displayed on the screen and / or recorded in the corresponding files.
For a user familiar with the graphical interface, this approach may seem inconvenient and outdated, but, fortunately, this is just a common misconception. After working out the basic skills, the efficiency of data processing using the keyboard and the command line interface is not lower, but higher than with the mouse and graphical interface. One of the reasons is that it is extremely difficult, if not impossible, to put in the menu and icons hundreds of functions used in statistical analysis, and the command line R accepts any combination of functions that is correct from the interpreter's point of view [1].
')
R provides ample opportunities that can be demonstrated on the example of analyzing the moods of users of the social network Twitter.
Late at night on February 26, information about the tragic death of the famous British actor Rowan Atkinson began to spread among users. This fact was not confirmed, but the number of messages increased, and the news of the death of the actor who played Mr. Bean rather quickly became a Twitter trend. Reports of the death of the actor contained the phrase RIP Rowan Atkinson. Using the capabilities of R, you can analyze the event in question and visualize the stages of information dissemination.
The analyzed data is a text array containing information about the sender, date, time and message text.
Data obtained as follows:
library(twitteR)
tweets = searchTwitter("RIP Rowan Atkinson", n=1500)
data = twListToDF(tweets)
Using the data obtained, it is possible to visualize the process of creating an information flow and track the time when users were most active.
Figure 1 displays the number of messages generated by users by day. According to the presented schedule, you can trace the appearance of the first message, the increase in the number of messages and the achievement of its peak in the first half of the day. Further, there is a gradual decline and extinction of user interest in this topic.
Figure 1. The number of messages per day
The schedule is as follows:
library(ggplot2)
c <- ggplot(data, aes(created))
c + geom_bar()
Figure 2 shows the distribution of sent messages by the hour. The graph shows that the first messages began to appear after 20 hours on February 26th, and the largest number of messages fell on the morning of February 27th.
Figure 2. Distribution of sent messages by the hour
The schedule is as follows:
library(ggplot2)
data$month=sapply(data$created, function(x) {p=as.POSIXlt(x);p$mon})
data$hour=sapply(data$created, function(x) {p=as.POSIXlt(x);p$hour})
data$wday=sapply(data$created, function(x) {p=as.POSIXlt(x);p$wday})
ggplot(data)+geom_jitter(aes(x=wday,y=hour))
Figure 3 shows the cloud of the most common words in user messages.
Figure 3. The cloud of the most common words in messages
The schedule is as follows:
library("tm")
text = Corpus(DataframeSource(data.frame(data[1])))
text = tm_map(text, removePunctuation)
text = tm_map(text, tolower)
tdm = TermDocumentMatrix(text)
m = as.matrix(tdm)
v = sort(rowSums(m),decreasing=TRUE)
library("wordcloud")
wordcloud(names(v), v^0.3, scale=c(5,0.5),random.order=F, colors="black")
The given example shows how wide the possibilities of R. Already on such a small sample of data is, it is possible to analyze the social aspects of the dissemination of information and highlight some patterns using the graphs created in R.
Currently, implementations of R exist for the three most common families of operating systems: GNU / Linux, Apple Mac OS X, and Microsoft Windows. As of the end of September 2010, in the distributed repositories of the CRAN system, 2548 expansion packs were available for free, focused on specific data processing problems arising in econometrics and financial analysis, genetics and molecular biology, ecology and geology, medicine and pharmaceuticals and many others application areas. A significant part of European and American universities in recent years have been actively switching to the use of R in educational and research activities instead of expensive commercial developments [1].
Literature
1. Statistical analysis of data in the system R. Tutorial / A.G. Bukhovets, P.V. Moskalev, V.P. Bogatova, T.Ya. Biryuchinskaya; Ed. prof. Bukhovtsa A.G.-Voronezh: VSAU, 2010. - 124s.
Source: https://habr.com/ru/post/140093/
All Articles