Monitoring of distributed and cloud infrastructure
In the last article I reviewed the various types of monitoring of simple web projects and websites, when the site does not require a level of reliability of 99.99%, when the response time may be hours or days. In general, when everything is simple. In this article, I will reveal the mechanisms for monitoring the cloud infrastructure, when a simple signal is not available / available is not enough to understand what the problems are and how to solve them promptly. Or when solving a problem may require a large number of actions, which can only be partially automated.
Typically, the level of reliability of the infrastructure of the project allows you to leave the reaction time to the problems encountered the same - hours or even days. But at the same time there are a number of places, decisions on which should be made in (semi) automatic mode in order to exclude the human factor and minimize system downtime. The triggers of such solutions will be discussed below. I want to immediately note that almost all the described monitoring technologies are used in the new cloud-based social intranet service - Bitrix24.
When building a fault-tolerant distributed infrastructure, in addition to providing several levels of reliability, usually several layers of system monitoring are included. Among them are:
Munin provides a large amount of information about the status of the desired server. The most frequently checked points include:
Some pictures of real system monitoring (download and database)

')
For example, the script checks for free space in the InnoDB MySQL table
A large list of popular plugins can be found in the GIT repository.
Nagios as a monitoring solution is definitely good. But you need to be prepared for the fact that in addition to it, you will have to use your own scripts and (or) Pinba (or a similar solution for your programming language). Pinba handles UDP packets and collects information about the execution time of scripts, the amount of memory and error codes. In principle, this is enough to create a complete picture of what is happening and to ensure the required level of service reliability in automatic mode.
At the level of internal monitoring, it is already possible to make decisions on the allocation of additional capacity (if this is possible automatically, then it is enough to simply monitor the average level of processor utilization on the application servers or the database, if this is done manually, then you can send letters or jabber messages) or turning them off. Also, in the event of an abnormal number of errors (usually this happens when a hardware failure or an error occurs in a new version of the web service, you can always install it through additional checks) you can send emergency SMS notifications or make a phone call.
It is also very convenient to configure automatic addition (or deletion) of tests when increasing test points (for example, servers or user sites) with predetermined patterns: for example, checking the main page, distributing PHP runtime, distributing memory usage for PHP, number of nginx and PHP errors.
Monitoring at the cloud infrastructure level does not offer such a large number of providers, and it is rather informational: real decisions are made either on the basis of internal data or the external state of the system. At the intermediate level, you can only collect statistics or confirm the internal state of the infrastructure.
For Amazon ( CloudWatch ), the following check options are available here:
Already, based on the results of monitoring an intermediate (at the level of balancers), it is possible to make an informed decision about the allocation or closure of machines (instances) in a cluster. This is exactly what is being done in Bitrix24: as soon as the load status of the application servers becomes too large (more than 60%), new instances begin to run. Conversely, when the load is reduced to less than 40%, the instances close.
Here the choice of solutions is very large. If you want to track the status of servers around the world, the best solution is Pingdom . For Russian realities, PingAdmin , Monitorus or WEBO Pulsar (the latter two have a network of servers in Russia). It is especially convenient to set up check from several points (for example, Moscow + St. Petersburg) and pull the remote notification script if the service is not available within 1-2 minutes. If at the same time there are any problems inside, then you can immediately switch to plan “B” (turn off inactive servers, pour notifications, etc.).
Additional advantages of external monitoring include checking the real-time response on the server side (or real network delays). By this parameter, you can also configure notifications. As an additional option when using a CDN: you can track the total load time of the service pages and disable or enable CDN for different regions.
PS article review, more about the monitoring architecture of large projects. I will tell about concrete applied things in the following articles.
Typically, the level of reliability of the infrastructure of the project allows you to leave the reaction time to the problems encountered the same - hours or even days. But at the same time there are a number of places, decisions on which should be made in (semi) automatic mode in order to exclude the human factor and minimize system downtime. The triggers of such solutions will be discussed below. I want to immediately note that almost all the described monitoring technologies are used in the new cloud-based social intranet service - Bitrix24.
Not enough
When building a fault-tolerant distributed infrastructure, in addition to providing several levels of reliability, usually several layers of system monitoring are included. Among them are:
- Built-in monitoring , issuing data on the physical parameters of servers (disk operations, memory, CPU, network, system, etc.). As a solution, Munin is often used ( many have already written about him in Habré ) with a large set of plug-ins that allow you to control every problem point. Plug-ins, in fact, are console scripts that check a certain parameter of a system with a specified frequency. Theoretically, already at this level, you can use a trigger mechanism to carry out "unloading" actions with the server. But in practice, the next level of monitoring is used for making decisions; embedded monitoring is used only for collecting statistics and analyzing system parameters “from the inside”.
- Internal monitoring implies the prevention of the condition of the entire infrastructure or its part at the level of the infrastructure itself. This means that along with working servers (applications, databases), the system must have servers monitoring its state and transmitting this information (in critical cases) to an address (for example, sending SMS notifications, or launching new application servers, or recording information about working application servers on the balancer). The most commonly used solution here is Nagios ( articles on Habré ) with a large number of checks (several hundred or thousands usually). In addition, Pinba ( Habr ) is also connected to it in the case of PHP applications for more accurate problem analysis.
- Usually, the two previous levels of monitoring are sufficient to detect and resolve all infrastructure problems, but often (in the case of clouds) there is still intermediate monitoring , when both the monitoring of the status of all infrastructure servers and the analysis of all requests passing through the power allocated in the cloud are monitored. Intermediate monitoring is used as an additional level of quality control of the service (for example, it is easy to track the number of 500 errors, even if the application servers are operating normally) and make a decision about switching capacities between geo-clusters (for example, this is possible with Amazon ).
- Finally, external monitoring is used to analyze the situation on the part of users. Even if the system is working properly, the connectivity between the servers is not broken, the servers respond quickly and stably, users may experience problems using the service, and this will depend on the overall state of the Network. At this level, additional triggers are possible to make decisions about switching users to other geo-clusters (for example, European users of Bitrix24, to lead to a European data center, and American users to an American one) to improve the quality of service. Also this level of monitoring can be used for additional verification of the results of internal and intermediate monitoring.
Built-in monitoring
Munin provides a large amount of information about the status of the desired server. The most frequently checked points include:
- Check PHP (runtime, memory usage, number of hits per process, etc.)
- Check nginx (response codes, memory usage, number of processes)
- Check mysql (the number of requests, memory usage, the execution time of requests)
- Disk check
- Check mail daemon
- Network check
- System check
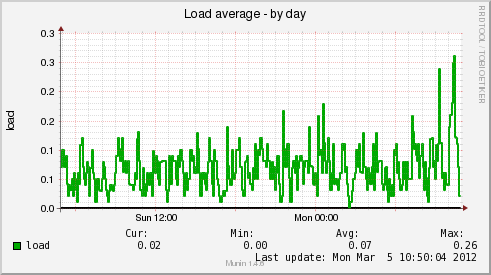
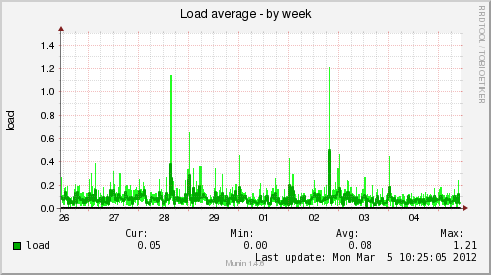
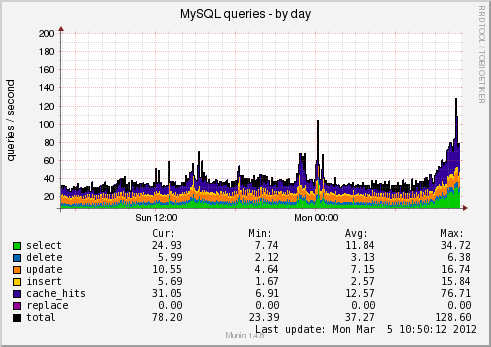
Some pictures of real system monitoring (download and database)
')
For example, the script checks for free space in the InnoDB MySQL table
  ## Tunable parameters with defaults
 MYSQL = "$ {mysql: - / usr / bin / mysql}"
 MYSQLOPTS = "$ {mysqlopts: --- user = munin --password = munin --host = localhost}"

 WARNING = $ {warning: -2147483648} # 2GB
 CRITICAL = $ {critical: -1073741824} # 1GB

 ## No user serviceable parts below
 if ["$ 1" = "config"];  then
     echo 'graph_title MySQL InnoDB free tablespace'
     echo 'graph_args --base 1024'
     echo 'graph_vlabel Bytes'
     echo 'graph_category mysql'
     echo 'graph_info Amount of InnoDB tablespace bytes in the table'
     echo 'free.label Bytes free'
     echo 'free.type GAUGE'
     echo 'free.min 0'
     echo 'free.warning' $ WARNING:
     echo 'free.critical' $ CRITICAL:
     exit 0
 fi

 # Get freespace from mysql
 freespace = $ ($ MYSQL $ MYSQLOPTS --batch --skip-column-names --execute \
     "SELECT table_comment FROM tables WHERE TABLE_SCHEMA = 'munin_innodb'" \
     information_schema);
 retval = $?

 # Sanity checks
 if ((retval> 0));  then
     echo "Error: mysql command returned status $ retval" 1> & 2
     exit -1
 fi
 if [-z "$ freespace"];  then
     echo "Error: mysql command returned no output" 1> & 2
     exit -1
 fi

 # Return freespace
 echo $ freespace |  awk '/ InnoDB free: / {print "free.value", $ 3 * 1024}'
A large list of popular plugins can be found in the GIT repository.
Internal monitoring
Nagios as a monitoring solution is definitely good. But you need to be prepared for the fact that in addition to it, you will have to use your own scripts and (or) Pinba (or a similar solution for your programming language). Pinba handles UDP packets and collects information about the execution time of scripts, the amount of memory and error codes. In principle, this is enough to create a complete picture of what is happening and to ensure the required level of service reliability in automatic mode.
At the level of internal monitoring, it is already possible to make decisions on the allocation of additional capacity (if this is possible automatically, then it is enough to simply monitor the average level of processor utilization on the application servers or the database, if this is done manually, then you can send letters or jabber messages) or turning them off. Also, in the event of an abnormal number of errors (usually this happens when a hardware failure or an error occurs in a new version of the web service, you can always install it through additional checks) you can send emergency SMS notifications or make a phone call.
It is also very convenient to configure automatic addition (or deletion) of tests when increasing test points (for example, servers or user sites) with predetermined patterns: for example, checking the main page, distributing PHP runtime, distributing memory usage for PHP, number of nginx and PHP errors.
Intermediate monitoring
Monitoring at the cloud infrastructure level does not offer such a large number of providers, and it is rather informational: real decisions are made either on the basis of internal data or the external state of the system. At the intermediate level, you can only collect statistics or confirm the internal state of the infrastructure.
For Amazon ( CloudWatch ), the following check options are available here:
- Full traffic (instances and aggregate).
- The number of responses from the balancer.
- The state of the instances (including infrastructure, which produce internal monitoring).
- And a number of others that can be combined with internal ones, but it is better to leave the maximum of logic at the level of internal monitoring.
Already, based on the results of monitoring an intermediate (at the level of balancers), it is possible to make an informed decision about the allocation or closure of machines (instances) in a cluster. This is exactly what is being done in Bitrix24: as soon as the load status of the application servers becomes too large (more than 60%), new instances begin to run. Conversely, when the load is reduced to less than 40%, the instances close.
External monitoring
Here the choice of solutions is very large. If you want to track the status of servers around the world, the best solution is Pingdom . For Russian realities, PingAdmin , Monitorus or WEBO Pulsar (the latter two have a network of servers in Russia). It is especially convenient to set up check from several points (for example, Moscow + St. Petersburg) and pull the remote notification script if the service is not available within 1-2 minutes. If at the same time there are any problems inside, then you can immediately switch to plan “B” (turn off inactive servers, pour notifications, etc.).
Additional advantages of external monitoring include checking the real-time response on the server side (or real network delays). By this parameter, you can also configure notifications. As an additional option when using a CDN: you can track the total load time of the service pages and disable or enable CDN for different regions.
PS article review, more about the monitoring architecture of large projects. I will tell about concrete applied things in the following articles.
Source: https://habr.com/ru/post/140091/
All Articles