Convergent billing for three popular hypervisors
 Good afternoon, habrovchane. Today we want to tell you about the product vOPS Server Standard company VKernel.
vOPS Server Standard is a monitoring system for hypervisors, which in general is sufficient on the market. Why are we interested in this particular product and how does it differ from the rest ? For example, the ability to simultaneously monitor Hyper-V, Red Hat Enterprise Virtualization (RHEV), and VMware. Curious. But we were even more interested in his billing capabilities. This feature of the product is indicated on the Microsoft technology partners page on the Self-Service portal.
Who needs it? First of all, those who want to provide services on the IaaS model.
')
So, this is what vOPS Server can do:
- resource planning
- performance monitoring
- optimization of resource utilization and costing,
- reporting, counting the cost of using resources, invoicing.
The last point is the most interesting - the system is able to collect statistics on the resources used by users, and generate reports on both the amount of resources available to the user, and how much he actually used them and how much money it all cost.

It looks beautiful, so proceed to install.
The 30-day trial version can be downloaded on the VKernel website . An interesting feature of the product: the server part does not need to be installed anywhere - just download the finished virtual machine under one of the supported hypervisors (VMware, Hyper-V, RHEV). Inside the virtual machine, openSUSE 11.4 Celadon lives, no settings other than the assignment of a static IP (which is also optional) are not necessary, everything is ready to receive and digest statistics from the hosts.
The web interface of the server is located at the address that the virtual machine received. First of all, we are offered to create connections to the hypervisor managers.
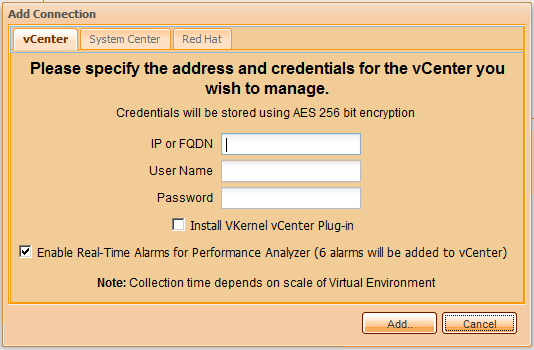
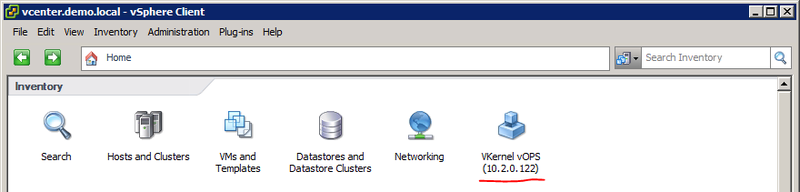
For VMware, enter the address of the vCenter and specify the user with administrator rights. If you tick the 'Install VKernel vCenter Plug-in' checkbox, the VKernel icon will be added to the vCenter, through which you can get to the same web interface, but through the vCenter window.
For RedHat, the same is the RHEVM address and administrator. But it is already more difficult to connect to Hyper-V. The fact is that vOPS uses System Center Operations Manager 2007 R2 and Virtual Machine Manager 2008 R2 to collect statistics from Hyper-V hosts (in the near future they promise support for System Center 2012). In order to make friends with all this, use a small program Hyper-V Collector (it is included in the package of files downloaded from the virtual machine for Hyper-V).
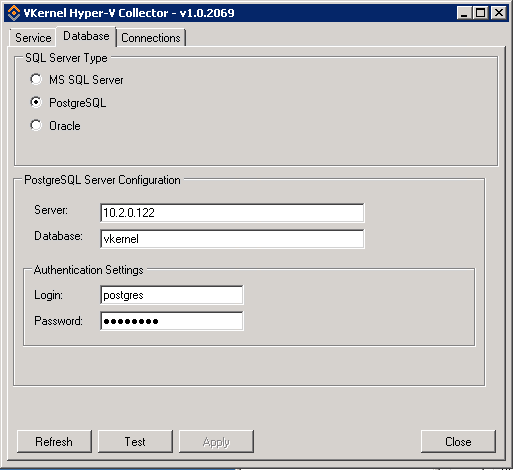
Create a separate virtual machine for Hyper-V Collector to create a bit of a bit of fat, so we put it together with VMM. When you start the Hyper-V Collector, a window with three tabs appears - Service, Database and Connections. In the Service tab, we check if the service is running.

In the Database tab, specify the SQL server to store information - you can choose MS SQL, PostgreSQL or Oracle. PostgreSQL already lives inside a virtual machine with a vOPS server, so we choose it. We also specify its address, vkernel database, login and password by default - postgres.
Now the Connections tab - here you need to add System Center Operations Manager 2007 R2. In this case, the connector will offer to add the necessary management packs. If for some reason this is not done automatically, packs can be added via the SCOM console by hand. You can find them in the C: \ Program Files (x86) \ VKernel \ VKernel Hyper-V Collector \ Management Pack folder.

We return to the web interface. Connection information can be viewed under the gear icon:

If everything was done correctly, the SCOM and Hyper-V hosts that it monitors will automatically be added to the navigation bar.
The interface at first seems cumbersome, but you quickly get used to it.
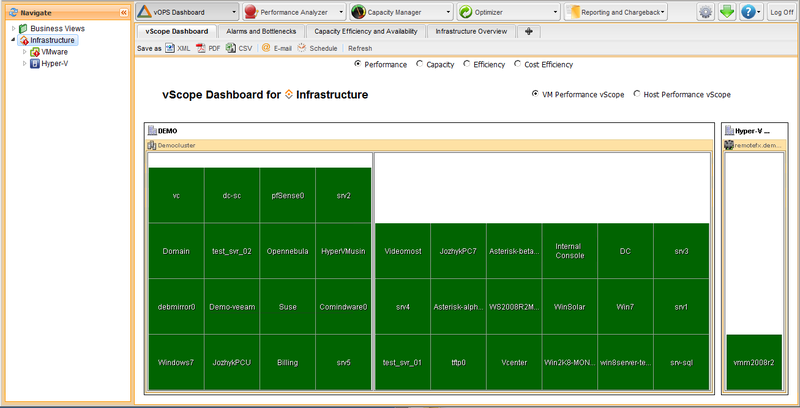
On the left is a navigation bar, with which you can navigate between infrastructure objects, at the top - 5 buttons.
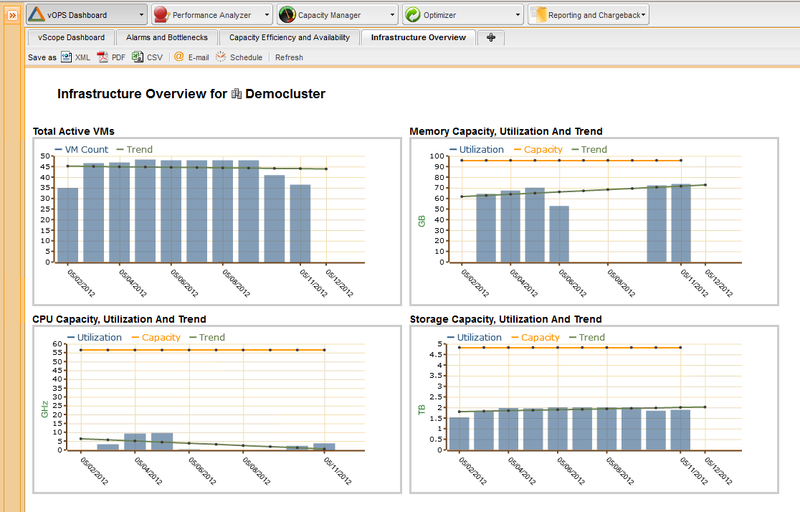
The vOPS Dashboard window has several pre-configured “dashboards” and tools to create new ones on your own.
Parformance Analyzer is used to analyze infrastructure performance, track errors that occur on hosts and virtual machines, generate and send periodic reports, etc.

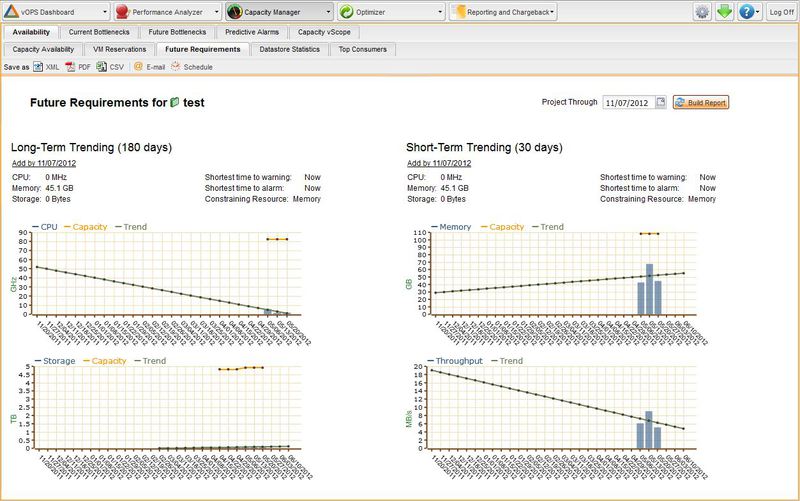
On the Capacity Manager tab, an analysis of resource availability and a forecast of needs for the next 180 days is available.
Optimizer offers the user recommendations for optimizing the use of resources.

Reporting and Chargeback contains reports on how much user owes us how much money.
Information is available on all items of the navigation menu - from the virtual machine to the entire infrastructure at once.
I’ll dwell on Reporting and Chargeback. For his work, you first need to come up with rates. This is done in the settings of the vOPS server - the gear icon in the upper right corner, the Prices tab.

The settings are quite flexible: you can count resources both on individual hosts and by specified groups, which eliminates the need to specify the cost of resources for each node of a single cluster. The cost of CPU, Memory and Network is measured in various units. A separate item is the cost of using disk space, while for storages also provides the possibility of grouping.
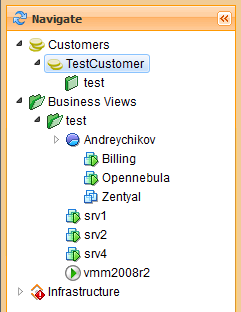
Now we will add clients so that the system starts counting the money we earned. Go to the Reporing and Chargeback section, select the Chargeback tab, the Customers line should appear in the navigation pane.

Click on it with the right button and add clients. Add in the section Business View (line below Customers) separate virtual machines or entire resource pools belonging to different clients. Now drag the created Business View to the customer names in the Customers section.
If nothing is messed up, we will receive a report on how much money we owe in accordance with the specified tariff.

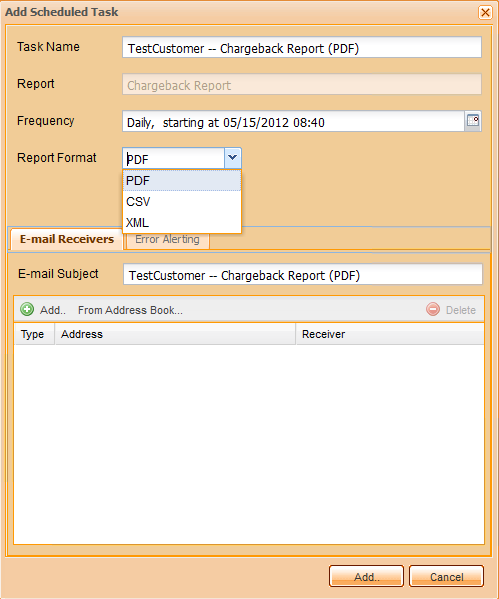
You can configure automatic distribution of reports to customers in one of three formats: pdf, csv or xml.
You can also configure the client to access the vOPS server site (of course, all the rights and objects that the client can see are configured).
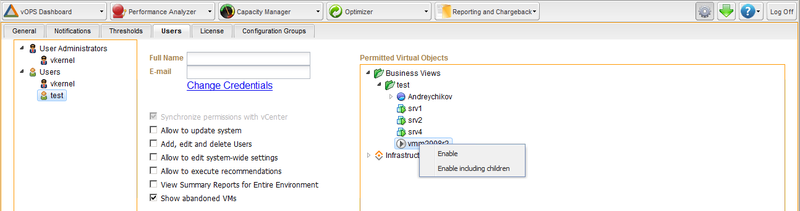
As a result, we have a rapidly deployable system of monitoring, forecasting and billing resources for the IaaS provider, which also knows how to do all the operations with different hypervisors in a common interface.
Masamasa ,
Systems Engineer DEPO Computers
Source: https://habr.com/ru/post/139522/
All Articles