Plotting on Android: sl4a, python and flot
Good day,% username%!
Charts - a visual way of presenting information. A picture is worth a thousand words, and a chart in some cases often completely describes the results of an experiment, physical or computational. In the end, I like the graphics.
Once I found myself in the situation that there is already data for plotting, but there is no computer at hand. But a smartphone can handle such a task! So I was able to force myself to start applying the knowledge gained from Google’s half- year Python course , and use sl4a, which was already covered with virtual dust. So, you will need sl4a (who has not heard such an abbreviation, read this , this and this ) + flot (any library for plotting graphs on js will work).
Along the abscissa we count the number of the observed value, along the ordinate its value. Values are calculated as follows: there are 30 logs containing lines of the form “value = 0.1 0.2 0.15 0.12 ...”, where “0.1 0.2 ...” are values, “value” is the name of the value. The value “1” is the average for all the first numbers from the corresponding log lines (“0.1” in the example string), “2” for all second numbers, etc. The result is a two-dimensional matrix of size M * N, where M is the number of lines in the log, N is the number of numbers in the line. It is assumed that the logs contain the same number of lines and the same number of numbers in each line.
')
For the construction of the plot is responsible plugin flot to jquery. From the complete set from the site of developers, only jquery.flot.js and jquery.js will be needed for our task. The log_manager.html code itself:
Line 13 - plotting with flot. For example, you can write
and a piece of parabola is displayed on the graph. Thus, the data for construction should be of the form [[x0, y0], [x1, y1], [x2, y2], [x3, y3], ...]. The easiest way that came to my mind is to prepare them in a python script into a string of exactly the same type and wrap it in javascript in eval (), which will execute the transferred string as if it were a piece of js code. Next, I use this method.
Modifying existing and adding new properties of displaying curves on a graph is easy to implement. For example, to disable the shadow under the curve, just add "shadowSize: 0":
Two curves on one graph:
In line 14, an object is created to interact with the Android API (it is returned by the “Android ()” function built into sl4a).
Line 15 describes how to handle the resulting event with the name “plotData”. As soon as an event with the same name is received, the function “plotData” is called. The data transmitted with it (string-array) will be in <input_variable_in_function_name> .data.
It remains only to write a script that will read the files, prepare the line and send it. About this next part.
Code log_manager.py:
This code is bad, so it’s not worth writing. But he performs his task: he gets a matrix consisting of the corresponding averages by logs.
In lines 1-43, data is read from files into a two-dimensional value array. At 44-48, a line is prepared for outputting the graph to flot. In 50-60, a webView is created based on the log_manager.html page (54), wait for 3 seconds, the script waits until the page is loaded (bad approach!) (57), and sends an event with data for plotting (60).
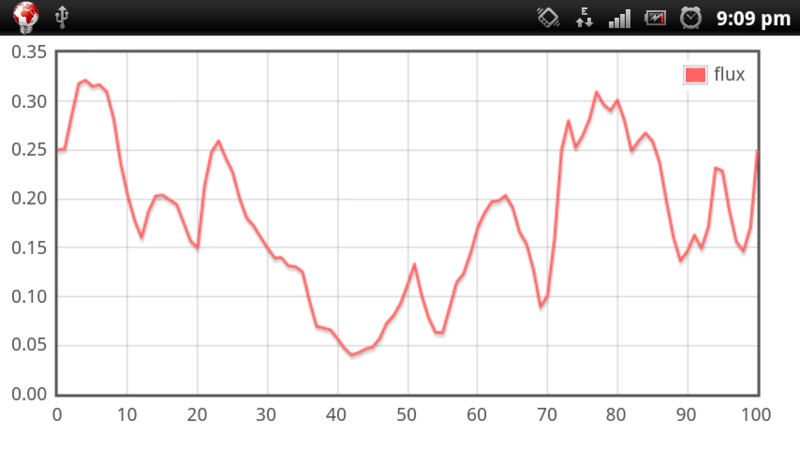
To test the script, you need to put log_manager.py, log_manager.html, jquery.flot.js and jquery.js in the folder / sdcard / sl4a / scripts. At the root of the memory card should be files with the names "864x864x30-0-of-30.log" ... "864x864x30-29-of-30.log". Each log should contain the same number of lines of the form “value = 0.2 0.34 0.343 ...” with the same number of numbers in each line. The script will build a graph based on the average values of the last lines of the logs and having the form:
Archive with the files mentioned in the article. Also in the archive there are jquery.js and jquery.flot.js from the set from the site flot.
Introduction
Charts - a visual way of presenting information. A picture is worth a thousand words, and a chart in some cases often completely describes the results of an experiment, physical or computational. In the end, I like the graphics.
Once I found myself in the situation that there is already data for plotting, but there is no computer at hand. But a smartphone can handle such a task! So I was able to force myself to start applying the knowledge gained from Google’s half- year Python course , and use sl4a, which was already covered with virtual dust. So, you will need sl4a (who has not heard such an abbreviation, read this , this and this ) + flot (any library for plotting graphs on js will work).
Along the abscissa we count the number of the observed value, along the ordinate its value. Values are calculated as follows: there are 30 logs containing lines of the form “value = 0.1 0.2 0.15 0.12 ...”, where “0.1 0.2 ...” are values, “value” is the name of the value. The value “1” is the average for all the first numbers from the corresponding log lines (“0.1” in the example string), “2” for all second numbers, etc. The result is a two-dimensional matrix of size M * N, where M is the number of lines in the log, N is the number of numbers in the line. It is assumed that the logs contain the same number of lines and the same number of numbers in each line.
')
Implementation
Graph display with flot
For the construction of the plot is responsible plugin flot to jquery. From the complete set from the site of developers, only jquery.flot.js and jquery.js will be needed for our task. The log_manager.html code itself:
<html> <head> <title>Plot</title> <link href="layout.css" rel="stylesheet" type="text/css"> <script src="jquery.js"></script> <script src="jquery.flot.js"></script> </head> <body> <div id="placeholder" style="width:535px;height:270px;"></div> <script> var plotData = function(d) {$.plot($("#placeholder"), [ {label: "flux", data: eval(d.data), color: "rgb(255, 100, 100)" }] );}; var droid = new Android(); droid.registerCallback("plotData", plotData); </script> </body> </html> Line 13 - plotting with flot. For example, you can write
$.plot($("#placeholder"), [ {label: "flux", data: [[0,0],[1,1],[2,4],[3,9],[4,16]], color: "rgb(255, 100, 100)" }] ); and a piece of parabola is displayed on the graph. Thus, the data for construction should be of the form [[x0, y0], [x1, y1], [x2, y2], [x3, y3], ...]. The easiest way that came to my mind is to prepare them in a python script into a string of exactly the same type and wrap it in javascript in eval (), which will execute the transferred string as if it were a piece of js code. Next, I use this method.
Modifying existing and adding new properties of displaying curves on a graph is easy to implement. For example, to disable the shadow under the curve, just add "shadowSize: 0":
$.plot($("#placeholder"), [ {label: "flux", data: [[0,0],[1,1],[2,4],[3,9],[4,16]], shadowSize: 0, color: "rgb(255, 100, 100)" }] ); Two curves on one graph:
$.plot($("#placeholder"), [ {label: "flux", data: [[0,0],[1,1],[2,4],[3,9],[4,16],[5,25]], shadowSize: 0, color: "rgb(255, 100, 100)" }, {label: "flux", data: [[0,0],[5,25]], shadowSize: 0, color: "rgb(255, 100, 100)" }] ); In line 14, an object is created to interact with the Android API (it is returned by the “Android ()” function built into sl4a).
Line 15 describes how to handle the resulting event with the name “plotData”. As soon as an event with the same name is received, the function “plotData” is called. The data transmitted with it (string-array) will be in <input_variable_in_function_name> .data.
It remains only to write a script that will read the files, prepare the line and send it. About this next part.
Preparing data with Python
Code log_manager.py:
#!/usr/python ## Import libraries # android for access to Android API # time for sleep(sec) import android, time # Filename is "<FileCounter>-of-<NumberOfFiles>.log" filename = "/sdcard/864x864x30-0-of-30.log" # Get number of files N = int(filename.split("/")[-1].split("-")[-1].split(".")[0]) # Read first file file = open(filename,"r") value = [] for line in file.readlines(): if "value =" in line: value.append([]) for val in line.split(" "): try: value[-1].append(float(val)) except: continue # Read other files for f in range(1, N): file = open(filename.replace("-0-","-"+str(f)+"-")) i = 0 for line in file.readlines(): if "value =" in line: j = 0 for val in line.split(" "): try: value[i][j] += float(val) j += 1 except: continue i += 1 # Prepare string for flot toBePlotted = "[" for i in range(0, len(value[-1])): toBePlotted += "[" + str(i) + "," + str(value[-1][i]) + "]," toBePlotted += "]" # Get droid object to use Android API droid = android.Android() # Set web view droid.webViewShow('file:///sdcard/sl4a/scripts/log_manager.html') # Wait 3 seconds while web view starts time.sleep(3) # Post event 'plotData' to web view droid.eventPost('plotData', toBePlotted) This code is bad, so it’s not worth writing. But he performs his task: he gets a matrix consisting of the corresponding averages by logs.
In lines 1-43, data is read from files into a two-dimensional value array. At 44-48, a line is prepared for outputting the graph to flot. In 50-60, a webView is created based on the log_manager.html page (54), wait for 3 seconds, the script waits until the page is loaded (bad approach!) (57), and sends an event with data for plotting (60).
results
To test the script, you need to put log_manager.py, log_manager.html, jquery.flot.js and jquery.js in the folder / sdcard / sl4a / scripts. At the root of the memory card should be files with the names "864x864x30-0-of-30.log" ... "864x864x30-29-of-30.log". Each log should contain the same number of lines of the form “value = 0.2 0.34 0.343 ...” with the same number of numbers in each line. The script will build a graph based on the average values of the last lines of the logs and having the form:
Archive with the files mentioned in the article. Also in the archive there are jquery.js and jquery.flot.js from the set from the site flot.
Source: https://habr.com/ru/post/139417/
All Articles