Random Sequence Analysis Using Simple Graphic Tests
annotation
This article contains a description of the method of graphical testing of random sequences that meet the criteria for truly random sequences. The article provides an overview of the Approximate Entropy method included in the NIST testing package, and a comparative analysis of the sequences obtained using the PRNG described in the Ocelot article Generating random numbers on microcontrollers .
Test "Approximate entropy"
The calculation of “Approximate Entropy” (Approximate Entropy) is one of the tests included in the NIST test suite.
This test consists in counting the frequency of all possible overlaps of patterns of length m bits during the initial sequence of bits. The purpose of the test is to compare the overlapping frequencies of two consecutive blocks of the original sequence with the lengths m and m + 1 with the frequencies of overlapping of similar blocks in a completely random sequence. The probability value p calculated during the test must be at least 0.01. Otherwise (p <0.01), the binary sequence is not completely arbitrary.
')
ApEn (m), where n is the length in bits of the incoming sequence; m is the length in bits of the initial block for testing; ε - bit sequence
Step 1
Complete the n-bit sequence to get exactly n overlaps with the m-bit sequence. To do this, add m-1 bit from the beginning of the sequence to its end.
For example: ε = 0100110101 and m = 3, then n = 10. Add 0 and 1 to the beginning of the sequence and to the end of the sequence. (This is done for each value of m).
The test sequence is 010011010101.
Step 2
The frequency is calculated for n overlapping blocks (for example: if a block containing ε j and ε j + m-1 is calculated in position j, then a block containing ε j + 1 and ε j + m is calculated in position j + 1).
Let the number of possible m-bit ((m + 1) -bit) values be represented as C m i , where i is the m-bit value.
For the test sequence obtained in step 1, the overlapping m-bit blocks (with m = 3) will be 010, 100, 001, 011, 110, 101, 010, 101, 010, and 101. The number of occurrences is 2 m = 2 3 = 8 m-bit sequences:
# 000 = 0, # 001 = 1, # 010 = 3, # 011 = 1, # 100 = 1, # 101 = 3, # 110 = 1, # 111 = 0
Step 3
We calculate C m i for each value of i.
C 3 000 = 0, C 3 001 = 0.1, C 3 010 = 0.3, C 3 011 = 0.1, C 3 100 = 0.1, C 3 101 = 0.3, C 3 110 = 0.1, C 3 111 = 0.
Step 4
Perform the calculation
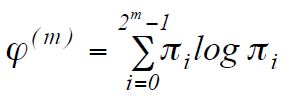 where
whereπ i = C 3 j , and j = log 2 i
For the current example: ϕ (3) = 0 (log 0) + 0.1 (log 0.1) + 0.3 (log 0.3) + 0.1 (log 0.1) +
0.1 (log 0.1) + 0.3 (log 0.3) + 0.1 (log 0.1) + 0 (log 0) = -1.64341772.
Step 5
Repeat steps 1-4 for m = m + 1
Step 6
We get the value ApEn (m) = φ (m) -φ (m + 1)
For the current example, ApEn (3) = -1.643418 - (-1.834372) = 0.190954
Incoming values
You must choose the values of n and m such that: m <log 2 n-5
Plotting
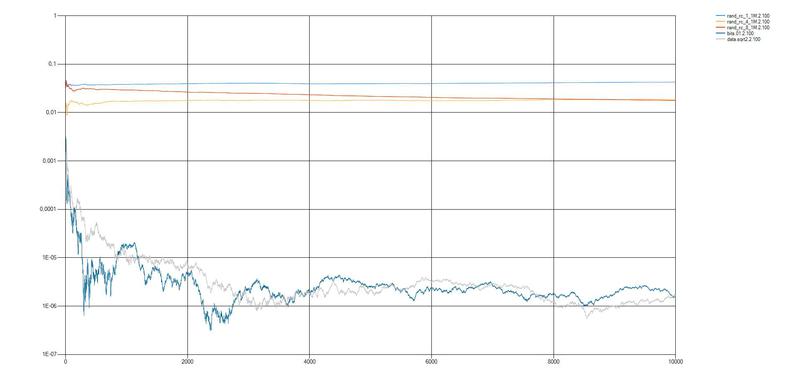
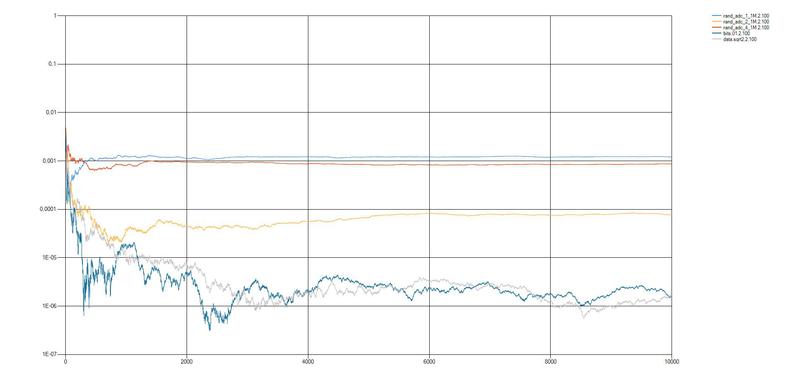
To obtain graphs, a series of tests were carried out for calculating ApEn with m = 2. The value of n varied in the range from 0 to 1,000,000 in increments of 100. A series of tests were also carried out in increments of 1. The results obtained in increments of 1 and increments of 100 did not have significant differences, therefore testing was performed in increments of 100. The approximate calculation time for one sequence is 1,000,000 bits takes about 7 minutes on an Intel Core i3 U380 1.33 GHz in one stream, and about 6:30 minutes in 16 streams. To display the graphs, a logarithmic Y scale is used, and the results are presented as deviations from the normal distribution. The calculation principle is described in the article STEVEN M. PINCUS Approximate entropy as a measure of system complexity
Graphical presentation of results
1. Source of entropy on asynchronous timers
Timer 1 - watchdog, clocking from RC generator, period T1 = 15 ms.
Timer 2 - 8 bit, clocking from the crystal oscillator, clock frequency F = 16.0 MHz.
rand_async_1_1M - 1 low bit of counter 2 was used as a result. The generation rate is 120 bps
rand_async_4_1M - 4 low bits of counter 2 were used as a result. The generation rate is 280 bps
rand_async_8_1M - all 8 bits of counter 2 were used as a result. The generation rate is 450 bps

2. Source of entropy with RC circuit
RC time constant = 5 ms. The clock frequency of the counter is F = 16.0 MHz.
rand_rc_1_1M - 1 least significant bit of the counter was used as a result. Generation rate 370 bps
rand_rc_4_1M - 4 low bits of the counter are used as a result. Generation rate 1500 bps
rand_rc_8_1M - all 8 bits of the counter are used as the result. The generation rate of 2870 bps
3. Source of entropy on ADC
The measured voltage is VDD = 3.3 V (non-stabilized), the reference voltage is VCC = 5.0 V. The bit width of the ADC is 10 bits, the conversion frequency is 125 kHz.
rand_adc_1_1M - 1 least significant bit of the ADC result was used as a result. The generation rate of 8.93 kbps
rand_adc_2_1M - 2 low-order bits of the ADC result were used as the result. Generation rate of 17.9 kbps
rand_adc_4_1M - 4 low-order bits of the ADC result were used as a result. The generation rate is 29.5 kbps
Conclusion
Looking at the graphical presentation of the results, we can conclude that the quality of random sequences obtained using microcontrollers is several orders of magnitude smaller than random sequences from the DIEHARD set and from the sequence obtained when extracting the square root from the number "2".
The use of random sequences obtained in modern cryptography is very dangerous, which is also confirmed by the results of the NIST and DIEHARD tests. A further stage of the study will be the use of undistributed statistical tests to identify truly random sequences.
Source: https://habr.com/ru/post/139085/
All Articles