Beginning debugging and profiling web applications
Introduction
There are many articles on Habré that describe interesting and complex aspects of web development, but there are many readers who, at the beginning of their web development career, would like to see material that would allow them to take the first step from "PHP 24 hours" to development at a serious level, and I would like to share my experience in this matter.
Features of a web application make it divided into two parts: client and server. On the client side, JavaScript code works (maybe VBScript can be found somewhere, but we probably won't consider this case), while on the server side there is a lot of that, in principle, but we consider PHP, the most popular language for server side of web applications. It would also be interesting to talk about debugging and profiling Flash applications on the client side, but the topic touched is so extensive, so for now let's leave it.
It can also be attributed to the tasks of debugging client code analysis and validation of HTML code. This, it seems, is a task not entirely from the field of programming, but also important.
')
Some parts of the considered problems have already been considered in other articles, and I have provided links to them.
Debugging and profiling client code
The “classic” way to debug JavaScript code is to use the
alert function and its derivatives. I remember that, at the beginning of my career, I personally wrote the print_r function for JavaScript, since I did not see an opportunity to display debugging information on arrays and objects. It looked like this: function print_r(variable) { if (variable instanceof Array || variable instanceof Object) { var key; for (key in variable) alert(key + ' => ' + variable[key]); } else { alert(variable); } } About any profiling of speech, of course, was not conducted at all.
With this approach, even information about the object console produces a revolution.
The specificity of the client side of a web application requires debugging of the code in all popular browsers. Of course, most often there is enough debugging in Internet Explorer and any
Mozilla firefox
Probably, Firefox can be called the pioneer of debugging client code. For a long time, it was indicated as the browser most suitable for development, and all thanks to the Firebug extension, which probably contains all the necessary features, except validation of HTML code.
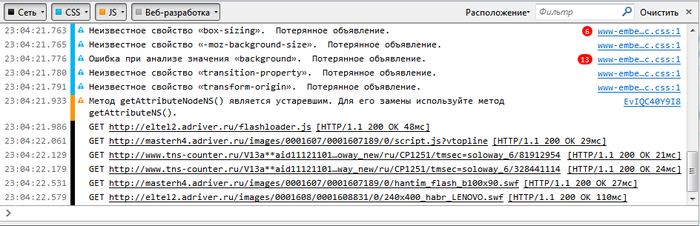
Also, starting from version 4, a built-in Web console has appeared, which implements some of the functions of the Firebug Console tab and Network, as well as some features for debugging CSS.
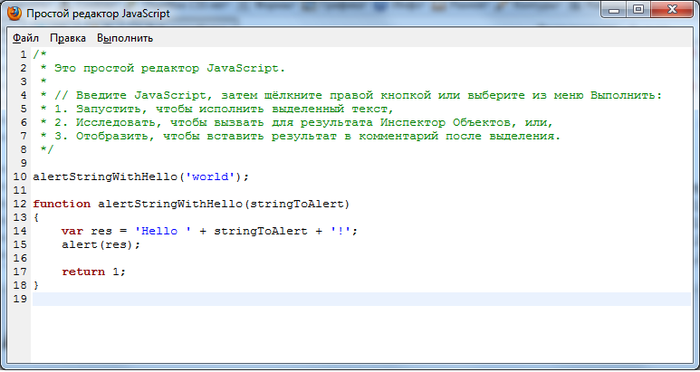
Starting from version 6, a Simple JavaScript editor appeared, which also implements one of the functions of Firebug, and allows you to write and execute code directly in the browser.
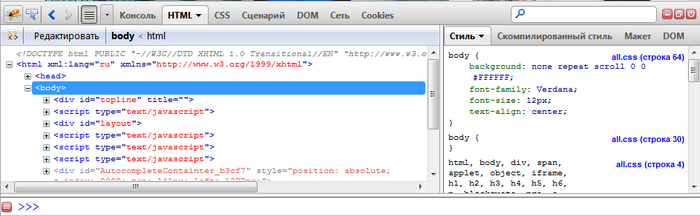
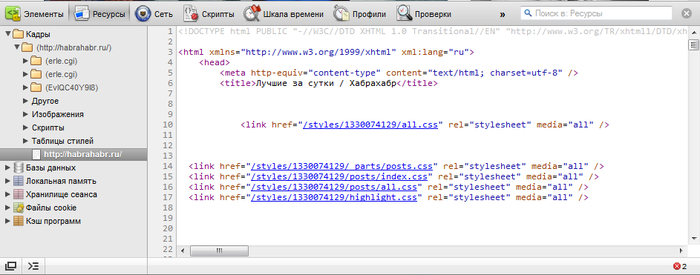
Starting from version 10, the Page Inspector appeared, which allows you to study HTML code and CSS properties, that is, it implements the functions of the “HTML” tab.

For the validation of HTML code is usually responsible extension Html Validator . Its icon indicating the number of errors on the main page of the site habrahabr.ru can be seen in the lower right corner of the browser in the picture with the Inspector of the pages.
Also, taking this opportunity, I will point out that for this browser there are many extensions that make life easier, as the corresponding article was already on Habré.
Google Chrome and Safari
These WebKit-based browsers have a built-in Web Inspector development tool that is very well developed and implements almost the same functions as Firebug. At the same time, we must pay tribute to him, he does not slow down the browser, which leads to the "big brother".
In Chrome, it can be triggered by pressing
Ctrl+Shift+I or simply by F12 . In Safari, it is well hidden, and to use it you need to enable development capabilities in your browser settings. Later, the developer’s tools will be available from the “Development” item of the main menu or by pressing the Ctrl+Alt+I key combination.To validate HTML code, you also need to install third-party extensions. For example, for Chrome, this could be Validity . For Safari has not yet managed to find anything suitable.
Opera
Opera also has a built-in developer tool called Opera Dragonfly, which can be called up at any time using the keyboard shortcut
Ctrl+Shift+I It is similar to what WebKit presents to us, and it has similar capabilities and advantages, although, in my opinion, it is less convenient.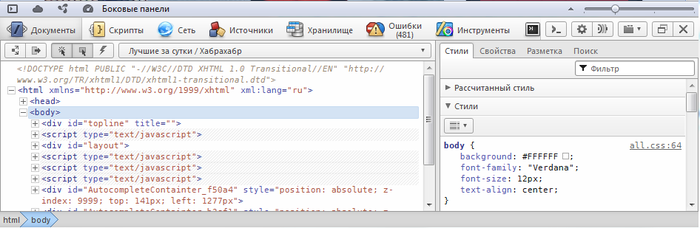
As comrade homm suggested , in Opera there is a simple means to send a page for validation to validator.w3.org. In the context menu of the site display area there is the item “Whether web standards are met”, which is responsible for this.
With extensions for validating HTML in the Opera catalog, the situation is tense. For this reason, the Validator extension has no alternatives.
Internet Explorer
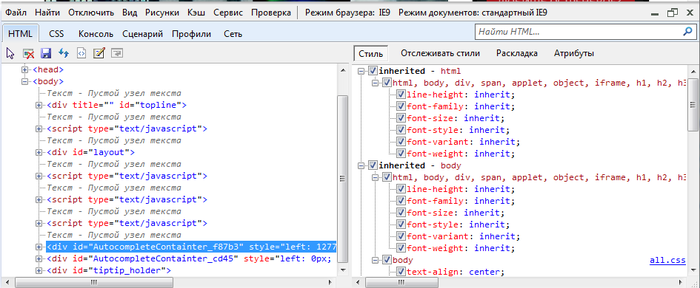
Starting from version 8 and here the developer toolkit appeared. It provides about the same features as in other browsers, but, as in other aspects of its activities, Internet Explorer provides them with some features and indescribable elegance. An important point is the ability to emulate older versions, as well as compatibility mode.
It is considered to be that in versions 7-, over which the seas of tears were shed by the web designers and JS programmers, there are no such tools. There is a third-party solution, Companion.JS, about which there was a corresponding article . Of course, its capabilities are significantly inferior to familiar tools, but at least this tool allows you to debug the code more advanced than “alert-oriented debugging”.
Comrade atd suggested that there was a “native” toolkit called “Internet Explorer Developer Toolbar” for these long-suffering versions, but it required a separate installation: www.microsoft.com/download/en/details.aspx?id=18359
Also, comrade k12th recalled that if you have Visual Studio, you can debug the code in it (components of the Web Development Tools). You can also find information about the free version of Visual Web Developer Express .
Debugging and profiling server code
Xdebug
As we agreed at the beginning, we consider the case when PHP is used on the server. Here the “classic” debugging method is
echo , print_r and var_dump , but there is also a tool for debugging, like in the best houses - Xdebug . For me personally, in connection with the specifics of studying at the institute, it looked “just like in Delphi”.The xdebug extension allows at least to run the code step by step and view the values of variables, which takes PHP programming to a new level. About the intricacies of working with xdebug was the corresponding article . XDebug is usually available in the GNU / Linux repositories; in Windows it is also not too difficult to install by copying the dll file.
When using this extension, an incoming connection (by default on port 9000) comes from the server to the developer’s computer, which it must process. To do this, you must properly configure your IDE.
Incidentally, the use of IDE is also a prerequisite for moving forward. Some programmers believe that the difference between programming in a notebook with code highlighting and in IDE can be seen only on large projects, but personally I am of the opinion that the difference is visible even in the program “Hello world!” - one automatic substitution of names and arguments of standard functions costs .
XHProf
About expansion
Yes, xdebug provides profiling capabilities, but the development of Facebook for this purpose, XHProf , I personally prefer. I, to be honest, did not conduct any tests, but it is believed that this extension is much better suited for production-servers and for profiling under real loads.
Installation
Unfortunately, this extension is not included in any repositories. It is included in PECL, but for some reason installing it in a regular way often causes problems. For this reason, you have to install from source.
# wget http://pecl.php.net/get/xhprof-0.9.2.tgz # tar -xvf xhprof-0.9.2.tgz # , cd xhprof-0.9.2/extension/ # phpize ./configure make make test # checkinstall The
xhprof.ini configuration xhprof.ini gives us something like this:[xhprof]
extension=/usr/local/lib/php/extensions/no-debug-non-zts-20090626/xhprof.so
;
xhprof.output_dir="/var/log/xhprof/"
Profiling
The directory that we get by unpacking the archive contains, in addition to the source code, an extension to the web interface for studying the results of profiling, and libraries for profiling the application.
We give an example of profiling. The following elements should be included in the application code:
// , // , xhprof_enable(XHPROF_FLAGS_CPU + XHPROF_FLAGS_MEMORY); /* * */ // , , // $xhprofData = xhprof_disable(); include_once XHPROF_DIR.'/xhprof_lib/utils/xhprof_lib.php'; include_once XHPROF_DIR.'/xhprof_lib/utils/xhprof_runs.php'; $xhprofRuns = new XHProfRuns_Default(); $namespace = 'some-unique-name'; $runId = $xhprofRuns->save_run($xhprofData, $namespace); echo "<!-- ", $runId, ' ', $namespace, " -->\n"; Here the constant
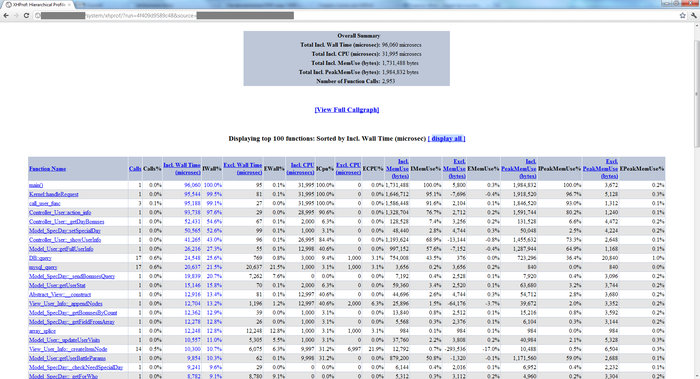
XHPROF_DIR points to the directory where we unpacked the downloaded archive.To analyze the results you need the same web interface. It can be taken in the
$XHPROF_DIR/xhprof_html/ - we denote it by convention. For example, we placed it in a place accessible to the web server, and it is available at example.com/system/xhprof/ , then to analyze the result of the work we need to refer to it as follows:example.com/system/xhprof/?run=%runId%&source=%namespace%We will get a similar result:
Profiling can be included in the application code on an ongoing basis or, for example, to make it run randomly with a certain probability or by the presence of a certain condition. For example:
$needProfiler = (mt_rand(0, 100) < 10 or isset($_COOKIE['xhprof'])); if ($needProfiler) xhprof_enable(XHPROF_FLAGS_CPU + XHPROF_FLAGS_MEMORY); In this case, you can, having complaints from customers or suspicions, refer to the results of profiling for a certain time period. Using the
namespace parameter, you can determine which part of the application (which script, controller, action) was profiled.SQL query profiling
As a rule, it is the work with the database that is the bottleneck in the application. For this reason, it is recommended to perform query profiling. For example, consider the part of the class that wraps around the mysql extension functions. Yes, I know that this extension is not very fond of and wish him dead no less than the good old IE6. I do not urge to use it, it is just such a class I have at hand.
/** * * @param string $sql * @param array $params * @param string $query * @return array */ public function query($sql, array $params = array(), &$query = '') { $start = microtime(TRUE); // , "" $stop = microtime(TRUE); $time = $stop - $start; $this->_addProfilerData($sql, $time); // } private function _addProfilerData($query, $time) { if (is_array(self::$profilerData)) { self::$profilerData[] = array( 'query' => $query, 'time' => $time ); } } public function __destruct() { if (is_array(self::$profilerData)) { $this->_writeProfilerData(); self::$profilerData = FALSE; } // } private function _writeProfilerData() { $values = array(); foreach (self::$profilerData as $row) { $query = mysql_real_escape_string($row['query'], $this->con); $time = (float)$row['time']; $hash = crc32($row['query']); $values[] = "($hash, '$query', $time)"; } if ($values) { $strValues = implode(', ', $values); $sql = "INSERT DELAYED INTO `profiler_queries` (`query_hash`, `query`, `work_time`) VALUES $strValues"; @mysql_query($sql, $this->con); } } Here the query profiling data is stored in the
profiler_queries table. This table can be of the type MyISAM or Archive, since they provide the ability to make deferred inserts, which does not create an excessive delay in the response when profiling. It is also better to create an INT type column to better search queries in the table, where a crc32 query hash will be written, for which you need to create an index.Conclusion
The article was quite large. Perhaps, here I walked through the tops and touched upon topics that were already mentioned, but if I had read something similar in my time - an article where all the information is gathered together and given useful links, it would be invaluable to me. I hope that my article will help someone on the path to enlightenment.
Links
- Use console to the full
- Firebug: Part 1 - console
- Firefox Extensions for Web Development for All Occasions
- Javascript debugger for IE
- Debugging PHP applications with xdebug
- PHP code profiling
- Pinba - monitor php in real time (suggested by trueneutral )
- Webgrind - Xdebug profiling web frontend (suggested by truezemez )
- Internet Explorer Developer Toolbar
- XDEBUG EXTENSION FOR PHP
- XHProf (GitHub)
Source: https://habr.com/ru/post/139004/
All Articles