As we consider users Cut the Rope. Part 1
In our company, we try to make decisions based on facts and real statistics. Therefore, how fast we are able to aggregate data depends on our further actions.
In games, this is especially important. You need to constantly monitor a bunch of different metrics: from the number of downloads and the place in the ranking, to how many levels the users pass on average and where difficulties arise.
All statistics can be divided into 2 categories:
Today I will talk about how we collect external statistics.
What metrics interest us? This is, first of all, the number of downloads (paid, free and updates), sales of games and IAP (purchases within games), reviews, average score and place in the ratings. We need to update this information daily, App Store ratings - hourly.
')
We started collecting statistics using products from several different services. It so happened that each of them deals only with part of the metrics, but does not show the overall picture:
However, if you have at least 3 applications in the stores, then you can manually collect statistics on them for hours. And as soon as you enter a new site, the amount of work grows exponentially.
The figure is our original situation.
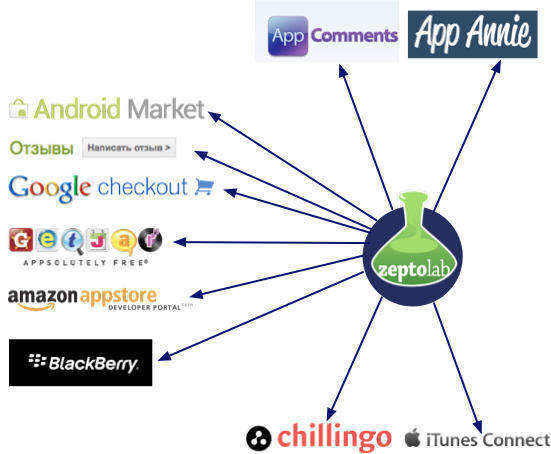
Each store must be connected and retrieved data manually using the interface of this store. In the end, it all came down to a single table in Excel.
We faced a dilemma: to write our own aggregator, bypassing each store / service, or use ready-made systems. We decided not to reinvent the wheel and see what is on the market.
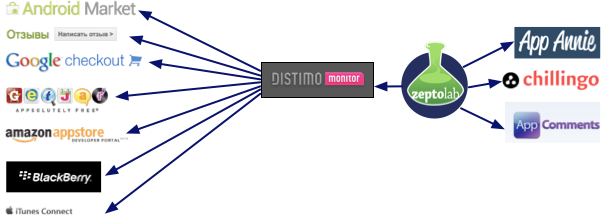
We spent some time choosing the best aggregator and stopped at the Distimo Monitor . It works with almost all large stores, allows you to collect all the listed metrics from each. After connecting, the situation became better:
Distimo helps us aggregate the following metrics:
However, there are still things that have to be collected manually.
First, Distimo works only with stoors, publisher accounts (in our case, Chillingo) will not be able to connect. Data from Chillingo also has to be processed by hand and summarized with the data obtained from Distimo.
Secondly, Distimo works only with large stores, small app stores or advertisers are not counted for them.
Thirdly, Distimo considers payments quite rudely: it does not take into account taxes, it does not always use a reliable exchange rate.
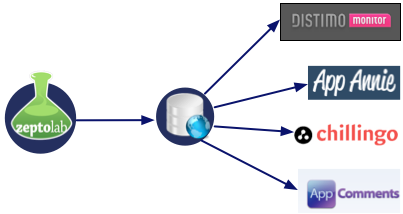
We want to have one system that can answer all our questions on statistics and save us from manual collection.
Therefore, we decided to collect all the data from Distimo, financial statistics and the remaining stor with the help of our own parser. Such a parser should constantly bypass services, collect data and add to the database.
Now we are creating such an aggregator ourselves, but we feel that we are not coping with the current composition. Therefore, if you understand server-side development, you want to work with Big Data and you know at least one of the scripting languages, come to us to write your own statistics system. A lot of work and all of it is interesting. Send your resume and project links to Github at job@zeptolab.com or kirilld@zeptolab.com .
Next time I will talk about the more interesting part of the statistics - analysis of user behavior, splitting them into groups and conversion calculations.
In games, this is especially important. You need to constantly monitor a bunch of different metrics: from the number of downloads and the place in the ranking, to how many levels the users pass on average and where difficulties arise.
All statistics can be divided into 2 categories:
- external ie one that is not directly related to the gameplay
- internal (in-game), reflecting user behavior within the game
Today I will talk about how we collect external statistics.
What metrics interest us? This is, first of all, the number of downloads (paid, free and updates), sales of games and IAP (purchases within games), reviews, average score and place in the ratings. We need to update this information daily, App Store ratings - hourly.
')
How we started collecting data
We started collecting statistics using products from several different services. It so happened that each of them deals only with part of the metrics, but does not show the overall picture:
- App Annie - shows the rating of applications in the App Store, allows you to watch the rating history, free
- AppFigures is an aggregator of downloads, payments, ratings and reviews, however it only works with App Store / Android Market, requires registration, paid
- AppComments - grabber reviews from the App Store. Does not require registration, free.
- iTunes Connect, Google Checkout, Android Market, and other web sites / publishers for collecting data on downloads and payments.
However, if you have at least 3 applications in the stores, then you can manually collect statistics on them for hours. And as soon as you enter a new site, the amount of work grows exponentially.
The figure is our original situation.
Each store must be connected and retrieved data manually using the interface of this store. In the end, it all came down to a single table in Excel.
Looking for a better solution
We faced a dilemma: to write our own aggregator, bypassing each store / service, or use ready-made systems. We decided not to reinvent the wheel and see what is on the market.
We spent some time choosing the best aggregator and stopped at the Distimo Monitor . It works with almost all large stores, allows you to collect all the listed metrics from each. After connecting, the situation became better:
Distimo helps us aggregate the following metrics:
- the number of downloads by day, country, application, device,
- payments for storages, applications and countries
- change the ratings of our applications in the stores, comparison with the ratings of other games,
- change the average score of applications in stor, new reviews, bad / good reviews.
However, there are still things that have to be collected manually.
First, Distimo works only with stoors, publisher accounts (in our case, Chillingo) will not be able to connect. Data from Chillingo also has to be processed by hand and summarized with the data obtained from Distimo.
Secondly, Distimo works only with large stores, small app stores or advertisers are not counted for them.
Thirdly, Distimo considers payments quite rudely: it does not take into account taxes, it does not always use a reliable exchange rate.
And yet write by yourself
We want to have one system that can answer all our questions on statistics and save us from manual collection.
Therefore, we decided to collect all the data from Distimo, financial statistics and the remaining stor with the help of our own parser. Such a parser should constantly bypass services, collect data and add to the database.
Now we are creating such an aggregator ourselves, but we feel that we are not coping with the current composition. Therefore, if you understand server-side development, you want to work with Big Data and you know at least one of the scripting languages, come to us to write your own statistics system. A lot of work and all of it is interesting. Send your resume and project links to Github at job@zeptolab.com or kirilld@zeptolab.com .
Next time I will talk about the more interesting part of the statistics - analysis of user behavior, splitting them into groups and conversion calculations.
Source: https://habr.com/ru/post/138423/
All Articles