Xdebug toolbar for debugging PHP in Opera
Instructions for setting up the Xdebug toolbar - for those who want to debug the code without fail in the Opera (as well as for those whom life has forced).
For debugging in the Opera, I found three ways:
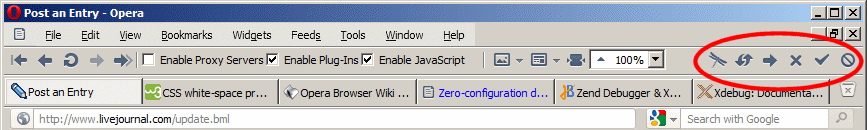
Left unsatisfied with all the options, I had to reinvent my own bicycle. Using the instructions below, you can add six buttons to the toolbar (five from the bookmarklet, one from Dragonfly).
Please note that the icons will depend on the current skin. With standard Windows, they look quite decent for themselves, but with other skins they may be less fortunate. Icons are set by the last part of the string of the button in quotes, so you can change it to your liking.
')
Successful debugging!
For debugging in the Opera, I found three ways:
- JetBrains bookmarklet generator . Click “Generate”, drag links to your toolbar and, depending on your settings, get either long buttons with text like “xdebug This page” (which takes up too much space), or completely identical unnamed buttons with page icons (impossible to use) .
- The plugin for Opera mentioned in the Xdebug documentation , which adds a button to switch debugging. Judging by the comments, the plugin does not even bother to set the path "/" in the liver.
- Manually add parameters to the URL.
Left unsatisfied with all the options, I had to reinvent my own bicycle. Using the instructions below, you can add six buttons to the toolbar (five from the bookmarklet, one from Dragonfly).
- Close the Opera (or force it to overload the toolbar at the end of the fraud).
- Open the profile directory (most likely, “% APPDATA% \ Opera \ Opera \ Profile” or “% PROGRAMFILES% \ Opera \ Profile”), open the toolbar file (most likely, “Toolbar \ standard_toolbar.ini”) in your favorite text editor.
- Find the text “[Browser Toolbar.content]” (or the name of any other toolbar where you want to add buttons - most importantly do not forget to enable the necessary toolbar in the settings).
- Add the following text at the end of the ini section:
Spacer15, 1
Button16, 1437536813="Open Developer Tools Window, , , , "DOM Console" | Close Developer Tools Window, , , , "DOM Console""
Button17="Go to page, "javascript:(/** @version 0.5 */function() {document.cookie='XDEBUG_SESSION='+'PHPSTORM'+';path=/;';document.location.reload();document.cookie='XDEBUG_SESSION='+''+';expires=Mon, 05 Jul 2000 00:00:00 GMT;path=/;';})()", , "xdebug This page", "Get And Send Mail""
Button18="Go to page, "javascript:(/** @version 0.5 */function() {document.cookie='XDEBUG_SESSION='+'PHPSTORM'+';path=/;';})()", , "xdebug Start session", "Forward""
Button19="Go to page, "javascript:(/** @version 0.5 */function() {document.cookie='XDEBUG_SESSION='+''+';expires=Mon, 05 Jul 2000 00:00:00 GMT;path=/;';})()", , "xdebug Stop session", "Stop""
Button20="Go to page, "javascript:(/** @version 0.5 */function() {document.cookie='PHPSTORM_XDEBUG_BREAK='+'1'+';path=/;';})()", , "xdebug Break On", "Mark As Read""
Button21="Go to page, "javascript:(/** @version 0.5 */function() {document.cookie='PHPSTORM_XDEBUG_BREAK='+''+';expires=Mon, 05 Jul 2000 00:00:00 GMT;path=/;';})()", , "xdebug Break Off", "Delete Mail"" - Change the number of the separator and the buttons so that they follow right behind the existing ones. For example, if the last line is “Button18 ...”, then the first line should be “Spacer19 ...”, then “Button20 ...”, etc.
- Save the file.
- Launch the Opera (or force it to reload the toolbar by switching the config to another and back).
Please note that the icons will depend on the current skin. With standard Windows, they look quite decent for themselves, but with other skins they may be less fortunate. Icons are set by the last part of the string of the button in quotes, so you can change it to your liking.
')
Successful debugging!
Source: https://habr.com/ru/post/138122/
All Articles