Simplify.js - JavaScript library to simplify broken lines
I am glad to present to your attention one more tiny, but useful open-source utility of my authorship - Simplify.js .
Simplify.js is a very fast implementation of javascript broken lines. Having originally written it for Leaflet (library for interactive maps), after a small optimization experiment, I wanted to release it as a separate library without dependencies, which can be used both in the browser and on server platforms, such as Node.js, and applied for 2D, and for 3D points.
')
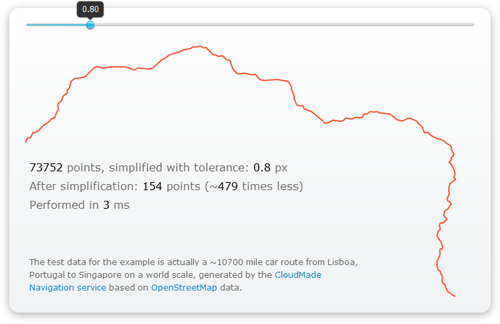
Such a simplification allows reducing the number of points in a broken line by several orders of magnitude (for example, representing a long route on a map or a chart), while preserving its outlines as much as possible (with a given accuracy). Accordingly, the size of the memory occupied by the line and the time required for its processing are sharply reduced.
Thanks to this, you can, for example, draw curves from tens and even hundreds of thousands of points in the browser using SVG or Canvas without any special brakes. You can verify this by watching the demonstration on the site and the corresponding test on JSPerf .
Use is trivial:
Simplify.js uses the Douglas-Pecker algorithm applied to an array of points previously screened based on the proximity of points to each other (which, due to a slight loss of accuracy, speeds up the application of the algorithm by about ten times), does not use expensive operations such as copying and sorting arrays, and applies typed arrays in browsers that support it.
Library website: mourner.github.com/simplify-js
GitHub Code: github.com/mourner/simplify-js
NPM package: simplify-js
License: BSD
If you figure out how to optimize it even more - I will be glad to see your pull requests. Thank!
Simplify.js is a very fast implementation of javascript broken lines. Having originally written it for Leaflet (library for interactive maps), after a small optimization experiment, I wanted to release it as a separate library without dependencies, which can be used both in the browser and on server platforms, such as Node.js, and applied for 2D, and for 3D points.
')
Such a simplification allows reducing the number of points in a broken line by several orders of magnitude (for example, representing a long route on a map or a chart), while preserving its outlines as much as possible (with a given accuracy). Accordingly, the size of the memory occupied by the line and the time required for its processing are sharply reduced.
Thanks to this, you can, for example, draw curves from tens and even hundreds of thousands of points in the browser using SVG or Canvas without any special brakes. You can verify this by watching the demonstration on the site and the corresponding test on JSPerf .
Use is trivial:
var points = [{x: 23, y: 53}, …]; … var simplified = simplify(points, 1.0); Simplify.js uses the Douglas-Pecker algorithm applied to an array of points previously screened based on the proximity of points to each other (which, due to a slight loss of accuracy, speeds up the application of the algorithm by about ten times), does not use expensive operations such as copying and sorting arrays, and applies typed arrays in browsers that support it.
Library website: mourner.github.com/simplify-js
GitHub Code: github.com/mourner/simplify-js
NPM package: simplify-js
License: BSD
If you figure out how to optimize it even more - I will be glad to see your pull requests. Thank!
Source: https://habr.com/ru/post/137852/
All Articles