Continuous monitoring of the JVM with Zabbix
Suppose you have a large application written in Java. This can be a web servlet hosted in a container or a standalone service. During the development process (and even during operation) there is a need to track the processes occurring in the JVM: the work of the garbage collector, memory usage, the life cycle of threads, as well as other indicators specific to your project through MBean. The easiest option is to use the profiler. But alas, problems do not happen on a schedule, and it is impossible to know in advance when you need to connect the profiler, and keeping it on all the time is also not an option. In such cases, the ideal solution is continuous monitoring. About him and will be discussed. But first, a couple of words about classical profiling.
Perhaps the easiest and most accessible method of monitoring an application. Profilers allow real-time monitoring of the state of the JVM, detailed analysis of the statistics of its work, up to an analysis of the activities of individual streams. There are both free and paid solutions on the market:
Profilers have one major drawback - you cannot keep it open 24 hours a day, 7 days a week. It is simply not intended for this. Why do we need such monitoring? Then, that you never know when your application will have problems. Continuous monitoring allows you to perform a summary analysis of statistics for the day, day, month, build initial assumptions about the reasons for the incorrect operation of the service / application, based on the graphs of memory usage, flows, and other metrics. For example, at night you run QA tests, and in the morning you analyze the behavior of the service based on continuous monitoring.
I did not find a ready-made system for an acceptable combination of price and quality, therefore, having extensive experience with Zabbix, I decided to adapt it to fit my needs (for those who are familiar with Zapcat - a couple of words about it will be at the end of the article). You can immediately ask: “why Zabbix, not Nagios ?”. I love finished products that work out of the box and do not require manual debugging and docking of modules.
So, let's get down to server cooking ;-)! To prepare the dish “Continuous monitoring JMX using Zabbix” we need:
Let me remind you that all actions are performed on a freshly installed OS.
')
If you already have a configured Zabbix server with client machines connected for monitoring, you can go directly to the next item.
Zabbix server and agent can be supplied both from the repository and collected from source. Usually there are very old versions of zabbix in the repositories, and they will work for tests, but for everyday use I recommend something newer. So, we put from the repository:
After installation, go to localhost / zabbix Log in as the Admin user with the password zabbix. Go to the tab “Configuration -> Hosts” and click on the “Zabbix Server”. Change the status from “Not monitored” to “Monitored”. Next, open the /etc/zabbix/zabbix_agentd.conf file in the editor and replace its contents with the suggested one:
In Zabbix UI, go to “Monitoring -> Last Data” and check that data has started to be collected from the local machine. This completes the basic configuration of Zabbix, proceed to the preparation of JMX.
We'll use tomcat as an experimental JVM. In order not to make connections to it using the RMI protocol, but to use HTTP, we use the JMX-HTTP bridge of Jolokia. For tomcat on the official site is available war-assembly . Rename the downloaded war file to jolokia.war and put it in / var / lib / tomcat6 / webapps. Restart tomcat. Open the address localhost : 8080 / jolokia and, if done correctly, we see the following information:
If you have a standalone application, then to connect jolokia to it, add the following parameter to the launch line:
where $ LIBDIR / jolokia-agent.jar is the path to the Jolokia JVM-Agent
Now we have Zabbix and JVM with a JMX-HTTP bridge connected to it. Need to organize data collection. The data collection scheme will be as follows:

Let me explain why I do not collect metrics directly, but use an intermediate buffer. If you configure the scheme without it, then for each request the JMX statistics collection script will be launched, which is a more resource-intensive operation than reading from the buffer. Therefore, I chose a model in which once every N seconds all metrics are collected, placed in files, and then read from files as needed.
For data collection, we will use the ready-made library of work with the JMX-HTTP bridge. The library is written in Perl and installed by means of CPAN:
After a successful installation, try to get the first metrics with tomcat using jmx4perl:
The result of the team should look like this:
As you can guess, we have just received information about using JVM Tomcat Heap memory.
Now you should write a script for collecting metrics, followed by placing them in the files of the specified directory. You can write your own or use my example:
Place the script in / usr / local / sbin and call it jmx_grabber. There is a possibility that the script will not work. This is associated with the first four metrics: GC_COPY_COLLECTION_COUNT, GC_MARK_SWEEP_COLLECTION_COUNT, GC_COPY_COLLECTION_TIME, GC_MARK_SWEEP_COLLECTION_TIME. Metrics display nothing more than “garbage collector” (GC) statistics. The names of the garbage collectors used in a particular JVM implementation may differ. For JVM HotSpot I met two pairs: PS Scavenge + PS MarkSweep and ConcurrentMarkSweep + Copy. If you have difficulties with determining the name of your GC, then run the command
and then search for the keyword "GarbageCollector". You will find something like:
The value “java.lang: name” is the name of one of the “garbage collectors”.
Now we will write the script in bash to get data from the files:
For the work of written scripts, we need the following Perl libraries: File :: Path, Module :: Find, JSON, Error. Install them:
Check whether everything is done correctly. Call the script with the following parameters:
The string "Java HotSpot (TM) Client VM" should return to us. Now we will create the / var / jmx folder and call the script with different parameters:
Check the contents of the / var / jmx folder. A subdirectory 8080 should appear in it containing JVM metrics files, one for each metric. It is not difficult to guess that the 8080 is a local port that is listened to by either the jolokia agent (standalone installation) or tomcat with the jolokia container.
Having configured the collection and reading of metrics, let's move on to the process of uploading them to Zabbix.
Add two lines to the /etc/zabbix/zabbix_agentd.conf file:
After that, do not forget to restart the zabbix agent. The added lines allow to access the file system scripts as usual Zabbix metrics. There is an alternative way: you can use the zabbix trapper, and send statistics in the active mode, do not use the zabbix agent. There are no big differences. In the case of using Zabbix-agent, the data collection periods are set in Zabbix via the UI. In case of using trapper, you will have to scatter cron-scripts of sending metrics via puppet (or its analogs).
Now it's time to create templates. I will not go deep into this process and attach the prepared xml file of the template that needs to be imported into Zabbix. To do this, open the “Configuration -> Export / Import” tab (in the latest Zabbix versions, the import is in “Configuration -> Templates”, then the “Import Template” button) and select from the “Import” list:

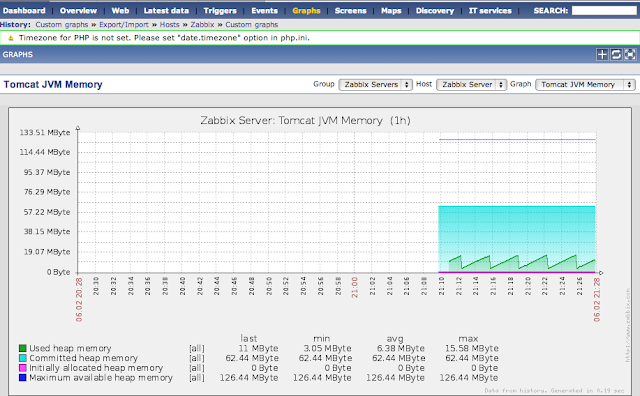
Now you need to assign the added template to our server. Go to the “Configuration -> Hosts” tab and click on the “Zabbix Server”. In the "Linked templates" panel, add our template "Template_Multitenant_Tomcat_JMX_Toolkit". Click on “Save”, then go to “Monitoring -> Last Data”. After 20 seconds you will receive the first statistics from the JVM Tomcat. If the data does not arrive, check whether the zabbix-agent is running and configured correctly (see above). After half an hour you can look at the graphs (“Monitoring -> Graphs”), there you will see something like the following for “Tomcat JVM Memory”:
Most likely, you will have a question, but what if there are several JVMs on the same physical / virtual machine? After all, port 8080 is clearly indicated in the template. Yes, this is an unpleasant feature, but in order to add several JVMs of one machine for monitoring, you need to create a separate template for each jolokia port from which data will be collected.
Well, we have a system for collecting metrics with JVM Tomcat. It would be great to try it out in action. For these purposes, I wrote a small service that creates threads, which, in turn, continuously generate objects in the JVM right up to their stop. Externally accessible management interface looks like this:
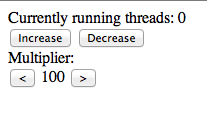
The “Increase” and “Decrease” buttons increase and decrease the number of threads, while the Multiplier gives you control over the multiplier of the time delay of the stream before generating the next object. Service can be downloaded here .
Place the service in Tomcat, and then perform the following manipulations:
As a result, we get the following graphs:
When I said that I did not find acceptable ready-made solutions, I was a little devious. One solution exists - this is Zapcat . And, by the way, using tomcat and Zabbix to cross it will not take more than 5 minutes. Why did I reinvent the wheel? There are two reasons for this:
In order to decide if you need the monitoring method I described, or if zapcat will be enough for you, as an easy-to-deploy alternative, ask the following questions:
The variant I proposed is not so much a complete monitoring system as a framework for building a service life control system based on specific tasks and needs. Together with the ability of Zabbix to detect its agents and automatically add network nodes to the monitor, the task of controlling the operation of java-services is simplified many times.
If you have any difficulties in setting up - write in a personal or in the comments, I will prompt as much as possible. For those who do not want to manually configure the test bench, I suggest using the ready-made way for VirtualBox (login red, password password).
Enjoy your experiments and stable JVM! ;-)
PS: I can respond to messages and comments only at lunch and in the evenings
Using the profiler
Perhaps the easiest and most accessible method of monitoring an application. Profilers allow real-time monitoring of the state of the JVM, detailed analysis of the statistics of its work, up to an analysis of the activities of individual streams. There are both free and paid solutions on the market:
- jconsole is a utility included in the hiking set of coffee collectors “ JDK Tools and Utils ”. Gives access to all basic JVM statistics, including direct work with MBeans.
- VisualVM - advanced analogues of jconsole. For some time ( when someone bought someone ) also comes with jdk. You can read about VisualVM and the basics of profiling in this article . From myself I’ll just add that if you need to connect the profiler to the JVM on a remote server, and you don’t want to bother, just find the visualvm binary on it, and then call it via ssh with the X session broadcast:
ssh -X login@domain /usr/bin/jvisualvm - JProfiler is the leader among commercial profilers (if someone has a wealth of experience in its application, I will be glad to learn it).
Continuous monitoring
Profilers have one major drawback - you cannot keep it open 24 hours a day, 7 days a week. It is simply not intended for this. Why do we need such monitoring? Then, that you never know when your application will have problems. Continuous monitoring allows you to perform a summary analysis of statistics for the day, day, month, build initial assumptions about the reasons for the incorrect operation of the service / application, based on the graphs of memory usage, flows, and other metrics. For example, at night you run QA tests, and in the morning you analyze the behavior of the service based on continuous monitoring.
I did not find a ready-made system for an acceptable combination of price and quality, therefore, having extensive experience with Zabbix, I decided to adapt it to fit my needs (for those who are familiar with Zapcat - a couple of words about it will be at the end of the article). You can immediately ask: “why Zabbix, not Nagios ?”. I love finished products that work out of the box and do not require manual debugging and docking of modules.
So, let's get down to server cooking ;-)! To prepare the dish “Continuous monitoring JMX using Zabbix” we need:
- Ubuntu Server 10.04 (Debian and RedHat can be used as substitutes)
- PostgreSQL or MySQL to taste
- Zabbix server
- Zabbix client
- Oracle Java (scripts from this article are oriented on JVM HotSpot)
- Jolokia (JMX-HTTP bridge) - helps to avoid problems with setting up JMX RMI connections
Let me remind you that all actions are performed on a freshly installed OS.
')
Zabbix Quick Setup
If you already have a configured Zabbix server with client machines connected for monitoring, you can go directly to the next item.
Zabbix server and agent can be supplied both from the repository and collected from source. Usually there are very old versions of zabbix in the repositories, and they will work for tests, but for everyday use I recommend something newer. So, we put from the repository:
sudo apt-get install zabbix-agent zabbix-server-pgsql zabbix-frontend-php php5-pgsql tomcat6After installation, go to localhost / zabbix Log in as the Admin user with the password zabbix. Go to the tab “Configuration -> Hosts” and click on the “Zabbix Server”. Change the status from “Not monitored” to “Monitored”. Next, open the /etc/zabbix/zabbix_agentd.conf file in the editor and replace its contents with the suggested one:
Server=127.0.0.1
Hostname=redcraft
StartAgents=16
DisableActive=1
EnableRemoteCommands=1
DebugLevel=4
Timeout=30
PidFile=/var/run/zabbix-agent/zabbix_agentd.pid
LogFile=/var/log/zabbix-agent/zabbix_agentd.log
In Zabbix UI, go to “Monitoring -> Last Data” and check that data has started to be collected from the local machine. This completes the basic configuration of Zabbix, proceed to the preparation of JMX.
Connecting Jolkia JVM Agents
We'll use tomcat as an experimental JVM. In order not to make connections to it using the RMI protocol, but to use HTTP, we use the JMX-HTTP bridge of Jolokia. For tomcat on the official site is available war-assembly . Rename the downloaded war file to jolokia.war and put it in / var / lib / tomcat6 / webapps. Restart tomcat. Open the address localhost : 8080 / jolokia and, if done correctly, we see the following information:
{"timestamp":1328444565,"status":200,"request":{"type":"version"},"value":{"protocol":"6.1","agent":"1.0.2","info":{"product":"tomcat","vendor":"Apache","version":"6.0.24"}}}If you have a standalone application, then to connect jolokia to it, add the following parameter to the launch line:
-javaagent:$LIBDIR/jolokia-agent.jar=port=9090,host=localhostwhere $ LIBDIR / jolokia-agent.jar is the path to the Jolokia JVM-Agent
Configure data collection with Jolokia
Now we have Zabbix and JVM with a JMX-HTTP bridge connected to it. Need to organize data collection. The data collection scheme will be as follows:
Let me explain why I do not collect metrics directly, but use an intermediate buffer. If you configure the scheme without it, then for each request the JMX statistics collection script will be launched, which is a more resource-intensive operation than reading from the buffer. Therefore, I chose a model in which once every N seconds all metrics are collected, placed in files, and then read from files as needed.
For data collection, we will use the ready-made library of work with the JMX-HTTP bridge. The library is written in Perl and installed by means of CPAN:
sudo cpan -i JMX::Jmx4PerlAfter a successful installation, try to get the first metrics with tomcat using jmx4perl:
jmx4perl localhost:8080/jolokia read java.lang:type=Memory HeapMemoryUsageThe result of the team should look like this:
{
committed => 65470464,
init => 0,
max => 132579328,
used => 10264072
}
As you can guess, we have just received information about using JVM Tomcat Heap memory.
Now you should write a script for collecting metrics, followed by placing them in the files of the specified directory. You can write your own or use my example:
#!/usr/bin/perl use strict; use warnings; use Error qw( :try ); use JMX::Jmx4Perl; use JMX::Jmx4Perl::Alias; use File::Path qw(make_path remove_tree); use Data::Dumper; my %source = ( GC_COPY_COLLECTION_COUNT => ["java.lang:name=Copy,type=GarbageCollector", "CollectionCount"], GC_MARK_SWEEP_COLLECTION_COUNT => ["java.lang:name=ConcurrentMarkSweep,type=GarbageCollector", "CollectionCount"], GC_COPY_COLLECTION_TIME => ["java.lang:name=Copy,type=GarbageCollector", "CollectionTime"], GC_MARK_SWEEP_COLLECTION_TIME => ["java.lang:name=ConcurrentMarkSweep,type=GarbageCollector", "CollectionTime"], THREAD_COUNT => ["THREAD_COUNT"], MEMORY_HEAP_COMITTED => ["MEMORY_HEAP_COMITTED"], THREAD_COUNT_DAEMON => ["THREAD_COUNT_DAEMON"], THREAD_COUNT_STARTED => ["THREAD_COUNT_STARTED"], MEMORY_HEAP_INIT => ["MEMORY_HEAP_INIT"], RUNTIME_VM_VENDOR => ["RUNTIME_VM_VENDOR"], MEMORY_HEAP_MAX => ["MEMORY_HEAP_MAX"], RUNTIME_VM_NAME => ["RUNTIME_VM_NAME"], CL_TOTAL => ["CL_TOTAL"], CL_LOADED => ["CL_LOADED"], CL_UNLOADED => ["CL_UNLOADED"], THREAD_COUNT_PEAK => ["THREAD_COUNT_PEAK"], RUNTIME_UPTIME => ["RUNTIME_UPTIME"], MEMORY_HEAP_USED => ["MEMORY_HEAP_USED"], RUNTIME_VM_VERSION => ["RUNTIME_VM_VERSION"], ); my $log_dir = "/var/jmx"; my $result = 0; my $port = $ARGV[0]; my $cmd = $ARGV[1]; if(defined $cmd && defined $port) { try { my $jmx = JMX::Jmx4Perl->new(url => "http://localhost:$port/jolokia/"); if($cmd eq "DUMP") { make_path("$log_dir/$port"); while(my($key, $value) = each %source) { open FILE, ">$log_dir/$port/$key" or throw Error::Simple("Could not open file"); print FILE $jmx->get_attribute(@$value) . "\n"; close FILE; } $result = 1; } else { my $param = $source{$cmd}; $result = $jmx->get_attribute(@$param); } } catch Error with { $result = 0; # --- Uncomment for debug --- #my $ex = shift; #print $ex->{-text}."\n"; #print $ex->{-line}."\n"; # --- Debug block ended --- }; } else { $result = 0; } print $result . "\n"; Place the script in / usr / local / sbin and call it jmx_grabber. There is a possibility that the script will not work. This is associated with the first four metrics: GC_COPY_COLLECTION_COUNT, GC_MARK_SWEEP_COLLECTION_COUNT, GC_COPY_COLLECTION_TIME, GC_MARK_SWEEP_COLLECTION_TIME. Metrics display nothing more than “garbage collector” (GC) statistics. The names of the garbage collectors used in a particular JVM implementation may differ. For JVM HotSpot I met two pairs: PS Scavenge + PS MarkSweep and ConcurrentMarkSweep + Copy. If you have difficulties with determining the name of your GC, then run the command
jmx4perl localhost:8080/jolokia attributes | lessand then search for the keyword "GarbageCollector". You will find something like:
java.lang:name=ConcurrentMarkSweep,type=GarbageCollector -- CollectionCount = 12
java.lang:name=ConcurrentMarkSweep,type=GarbageCollector -- LastGcInfo =
java.lang:name=ConcurrentMarkSweep,type=GarbageCollector -- CollectionTime = 0
java.lang:name=ConcurrentMarkSweep,type=GarbageCollector -- Name = ConcurrentMarkSweep
java.lang:name=ConcurrentMarkSweep,type=GarbageCollector -- Valid = [true]
The value “java.lang: name” is the name of one of the “garbage collectors”.
Now we will write the script in bash to get data from the files:
#!/bin/bash JMX_DIR="/var/jmx" if [ -r "$JMX_DIR/$1/$2" ]; then cat "$JMX_DIR/$1/$2" else echo 0; fi For the work of written scripts, we need the following Perl libraries: File :: Path, Module :: Find, JSON, Error. Install them:
sudo cpan -i File::Path
sudo cpan -i Module::Find
sudo cpan -i JSON
sudo cpan -i Error
Check whether everything is done correctly. Call the script with the following parameters:
/usr/local/sbin/jmx-grabber 8080 RUNTIME_VM_NAMEThe string "Java HotSpot (TM) Client VM" should return to us. Now we will create the / var / jmx folder and call the script with different parameters:
/usr/local/sbin/jmx-grabber 8080 DUMPCheck the contents of the / var / jmx folder. A subdirectory 8080 should appear in it containing JVM metrics files, one for each metric. It is not difficult to guess that the 8080 is a local port that is listened to by either the jolokia agent (standalone installation) or tomcat with the jolokia container.
Having configured the collection and reading of metrics, let's move on to the process of uploading them to Zabbix.
Unloading JVM metrics in Zabbix
Add two lines to the /etc/zabbix/zabbix_agentd.conf file:
UserParameter=jmx_grabber[*],/usr/local/sbin/jmx-grabber $1 $2
UserParameter=jmx_reader[*],/usr/local/sbin/jmx-stats-reader $1 $2
After that, do not forget to restart the zabbix agent. The added lines allow to access the file system scripts as usual Zabbix metrics. There is an alternative way: you can use the zabbix trapper, and send statistics in the active mode, do not use the zabbix agent. There are no big differences. In the case of using Zabbix-agent, the data collection periods are set in Zabbix via the UI. In case of using trapper, you will have to scatter cron-scripts of sending metrics via puppet (or its analogs).
Now it's time to create templates. I will not go deep into this process and attach the prepared xml file of the template that needs to be imported into Zabbix. To do this, open the “Configuration -> Export / Import” tab (in the latest Zabbix versions, the import is in “Configuration -> Templates”, then the “Import Template” button) and select from the “Import” list:
Now you need to assign the added template to our server. Go to the “Configuration -> Hosts” tab and click on the “Zabbix Server”. In the "Linked templates" panel, add our template "Template_Multitenant_Tomcat_JMX_Toolkit". Click on “Save”, then go to “Monitoring -> Last Data”. After 20 seconds you will receive the first statistics from the JVM Tomcat. If the data does not arrive, check whether the zabbix-agent is running and configured correctly (see above). After half an hour you can look at the graphs (“Monitoring -> Graphs”), there you will see something like the following for “Tomcat JVM Memory”:
Most likely, you will have a question, but what if there are several JVMs on the same physical / virtual machine? After all, port 8080 is clearly indicated in the template. Yes, this is an unpleasant feature, but in order to add several JVMs of one machine for monitoring, you need to create a separate template for each jolokia port from which data will be collected.
Testing
Well, we have a system for collecting metrics with JVM Tomcat. It would be great to try it out in action. For these purposes, I wrote a small service that creates threads, which, in turn, continuously generate objects in the JVM right up to their stop. Externally accessible management interface looks like this:
The “Increase” and “Decrease” buttons increase and decrease the number of threads, while the Multiplier gives you control over the multiplier of the time delay of the stream before generating the next object. Service can be downloaded here .
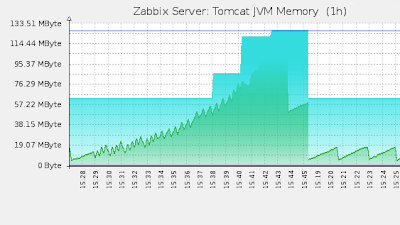
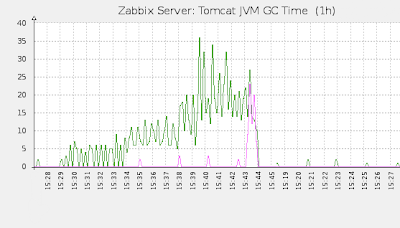
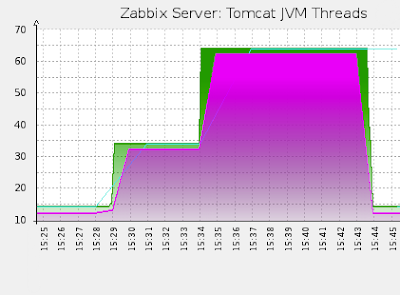
Place the service in Tomcat, and then perform the following manipulations:
- raise the number of threads to 20 and wait 5 minutes
- raise the number of threads to 50 and again wait 5 minutes
- reduce the stream delay multiplier to 50 and expect 5 minutes
- reset the number of threads to zero
As a result, we get the following graphs:
Zapcat
When I said that I did not find acceptable ready-made solutions, I was a little devious. One solution exists - this is Zapcat . And, by the way, using tomcat and Zabbix to cross it will not take more than 5 minutes. Why did I reinvent the wheel? There are two reasons for this:
- zapcat has not been updated since 2008. Not that it is really bad - it still worked tolerably well. But I don’t really want to use a system that no one supports.
- zapcat agent will connect to standalone services directly in the application code. For me, it looks as if a blood pressure monitor and other sensors were sewn to the children at birth, which could only be removed later through surgery. I really did not want to make zapcat (which is no longer supported) part of the application. This is not safe, and from an architectural point of view it is illiterate. In theory, zapcat can be issued as a javaagent, but I did not find ready-made implementations that can be connected using the same directive.
In order to decide if you need the monitoring method I described, or if zapcat will be enough for you, as an easy-to-deploy alternative, ask the following questions:
- Do I want to integrate monitoring tools into my application? (relevant only for standalone-services)
- Do I want to perform additional processing of intermediate data that has already been collected in the file system (or cache). You may want to calculate the average total for all copies of the services.
- Do I want to access the service / application of the jmx bridge using other tools other than zabbix?
At last
The variant I proposed is not so much a complete monitoring system as a framework for building a service life control system based on specific tasks and needs. Together with the ability of Zabbix to detect its agents and automatically add network nodes to the monitor, the task of controlling the operation of java-services is simplified many times.
If you have any difficulties in setting up - write in a personal or in the comments, I will prompt as much as possible. For those who do not want to manually configure the test bench, I suggest using the ready-made way for VirtualBox (login red, password password).
Enjoy your experiments and stable JVM! ;-)
PS: I can respond to messages and comments only at lunch and in the evenings
Source: https://habr.com/ru/post/137641/
All Articles