Practical bioinformatics, part 3. Assessment of the significance of experimental data
At each stage of the experiment, starting from the preparation of the material, continuing with PCR and ending with sequencing, an accumulation of error occurs. We need a mechanism to assess the significance of the result. What is the probability that the reads, which turned out to be at a certain part of the genome, turned out to be there by chance? The approach presented in this article is applicable to data obtained using DNA-seq, and talks about the possibility of applying the Poisson distribution to assess significance.
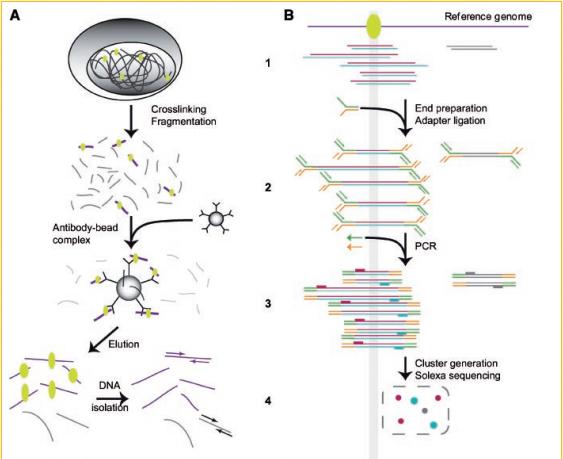
This illustration schematically depicts the process of preparing the material for sequencing. At each stage, an error is possible, resulting in a read on an arbitrary region of the genome.
The file with all the reads, of which millions in one sequencing, is transferred to the bowtie program, which is currently the fastest. The execution line for the bowtie program can be:
The parameters specified in the example characterize the following program behavior:
-q - processes the input file as FASTQ, not FASTA
-v - the number of errors in the read, in the above example, 2
-m - how many entries (reads) in the genome to search for, in this case, 1
-p - how many threads to use, I proceeded from the number of processor cores - 8
-S - means that the output file will be recorded in the .sam format
/usr/src/bowtie-0.12.7/indexes/hg19 - the path to the previously indexed genome, performed by the bowtie-build program. Also ready path can be downloaded from the Internet.
- (a dash at the end of the second line) means output to standard output for transfer to the samtools program, which converts it to .bam on the fly.
In the description, I missed the parameters --best --strata, which set a special bowtie mode: if the program finds more than one occurrence of a read in the genome with a different number of errors, then it displays the result with the least error. If the results with the least error are more than one, they are not displayed. This increases the time of the program, but at the same time allows to increase the sensitivity of the reads in the genome. Here is an example of the output of the .sam / .bam file:
')
The header (lines starting with @SQ, @HD, @PG) contains descriptions: the names of chromosomes and their lengths, whether the file is sorted, the command with which the file was received. The body consists of lines, each line is read, but with coordinates in the genome. More details can be found here http://genome.sph.umich.edu/wiki/SAM .
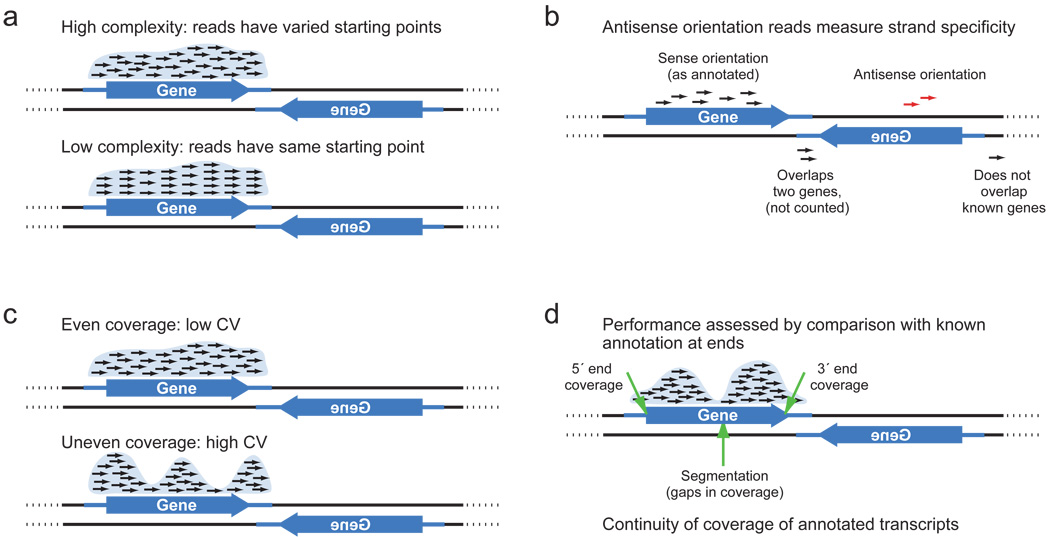
Genome distribution is different, but in enriched areas, it is considered that the experiment is more likely to succeed if the distribution has the following properties: even coverage (high coverage), high complexity (high complexity), continuity of coverage (continuous coverage). Examples, as reads can cover the genome, are depicted in the figures above.
To determine the enriched areas, we use the following reasoning. We add all the lengths of the chromosomes and subtract the length of the repeating sections (approximate length 2282603114 for hg19), we take the resulting length in G. We divide the length G into windows of width W (for example, 500). We take for N the number of the resulting windows (G / W approximately 4565206.228). Let's count the number of reads in the experiment that were successfully found in the genome (let it be 4E6 out of 4.5E6), we take their number as S. Then the average number of reads per window, we denote , will be = S * W / G = S / N.
Poisson distribution expresses the probability of the origin of a given number k of events over a period of time with a known average origin of events. The cumulative Poisson distribution will express the probability of occurrence of events of up to k. We will use the cumulative distribution, since we are interested in the probability that the number of reads in the window is less than k. Null hypothesis: k reads in a window by accident. Alternative hypothesis: k reads in the window is not accidental. The probability that our null hypothesis is true is even
 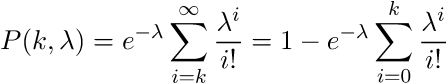 . The closer P (k, ) to 0, the less likely that the reads hit the specified window by accident. In our example, we obtain that if the number of reads in the window is up to 15, then 1-P (15.0.876193) = 2.55351E-15, i.e. The number of reads up to 15 can enter a window 500 wide by chance with a probability of 2.55351E-15. This number is also called p value. Consequently, if there are more than 15 reads, then they are even less likely to enter the window by accident. Thus, in the program, you can set the condition: if p value <= 1.e16, then the data in the window should be left for consideration, the rest should be discarded.
Below is an example of a program that uses part of the classes described in the previous article , and is complemented by a new class of PoissonHandler. Additional files to the first archive can be downloaded here . In the new poisson directory, type qmake, then make. The assembled poisson program builds a significance table for 500bp windows located behind the transcriptional start site of each gene, the annotation is selected from the browser's genes. A more detailed work with the genome browser will consider in another article. Next, reads from the .bam file that fall into our windows are selected, a Poisson distribution is built for them. The result is written to the file.
PoissonHandler.hpp
PoissonHandler.cpp
These small algorithms will later be useful for implementing more complex ones, such as ZINBA or SICER , for example. We will talk about them in another article. Often the task is to find enriched areas without using annotations. And then step by step, you need to select data that fell into the window and passed through the filter.
Comprehensive comparative analysis of strand-specific RNA sequencing methods
Nat Methods. 2010 September; 7 (9): 709-715.
Joshua Z. Levin, 1,6 Moran Yassour, 1,2,3,6 Xian Adiconis, 1 Chad Nusbaum, 1 Dawn Anne Thompson, 1 Nir Friedman, 3,4 Andreas Gnirke, 1 and Aviv Regev1,2,5
www.ncbi.nlm.nih.gov/pmc/articles/PMC3005310
Genomic Location Analysis by ChIP-Seq
J Cell Biochem. 2009 May 1; 107 (1): 11-8.
Artem Barski * and Keji Zhao *
Laboratory of Molecular Immunology, National Heart, Lung and Blood Institute, NIH, Bethesda, MD 20892
www.ncbi.nlm.nih.gov/pubmed/19173299
An integrated strategy for the next-generation sequencing data.
Genome Biol. 2011 Jul 25; 12 (7): 120.
Peng W, Zhao K.
Department of Physics, The George Washington University, 725 21st Street NW, Washington, DC 20052, USA. wpeng@gwu.edu
www.ncbi.nlm.nih.gov/pubmed/21787381
A clustering approach for identification of enriched domains from histone modification ChIP-Seq data.
Bioinformatics. 2009 Aug 1; 25 (15): 1952-8. Epub 2009 Jun 8.
Zang C, Schones DE, Zeng C, Cui K, Zhao K, Peng W.
Department of Physics, The George Washington University, Washington, DC 20052, USA.
www.ncbi.nlm.nih.gov/pubmed/19505939
ZINBA integrates local covariates with DNA-seq data, even within amplified genomic regions.
Genome Biol. 2011 Jul 25; 12 (7): R67.
Rashid NU, Giresi PG, Ibrahim JG, Sun W, Lieb JD.
Department of Biostatistics, Gillings School of Global Public Health, The University of North Carolina at Chapel Hill, Chapel Hill, NC 27599, USA.
www.ncbi.nlm.nih.gov/pubmed/21787385
Review by Andrey Kartashov, Cincinnati OH, mail: porter@porter.st
This illustration schematically depicts the process of preparing the material for sequencing. At each stage, an error is possible, resulting in a read on an arbitrary region of the genome.
- A.1 A cell with DNA is treated with formaldehyde for better protein fixation. Then DNA is cut into fragments in various ways, including ultrasound .
- A.2-3 An antibody is added that is sensitive to proteins. Fragments marked with protein are attached to the antibody. Some fragments are connected randomly.
- A.4. Deposition of antibodies with DNA fragments occurs. Purification of DNA fragments from antibodies and proteins.
- B.1-4 These items show the steps for preparing the obtained DNA fragments for sequencing. Adding special adapters. Multiplication with PCR. Placement on the slide.
@HWI-XXXXX_0470:1:1:1761:946#0/1 NCCCTTTGGATTTGTCCTTTCAGATGCATTAGCCAT +HWI-XXXXX_0470:1:1:1761:946#0/1 BKNNJMHHEJRTRRR_______________Y[[[Y_ The file with all the reads, of which millions in one sequencing, is transferred to the bowtie program, which is currently the fastest. The execution line for the bowtie program can be:
/usr/src/bowtie-0.12.7/bowtie -q -v 2 -m 1 --best --strata -p 8 -S \ /usr/src/bowtie-0.12.7/indexes/hg19 - | samtools view -Sb - >${DIRNAME}/${SEQNAME}.bam The parameters specified in the example characterize the following program behavior:
-q - processes the input file as FASTQ, not FASTA
-v - the number of errors in the read, in the above example, 2
-m - how many entries (reads) in the genome to search for, in this case, 1
-p - how many threads to use, I proceeded from the number of processor cores - 8
-S - means that the output file will be recorded in the .sam format
/usr/src/bowtie-0.12.7/indexes/hg19 - the path to the previously indexed genome, performed by the bowtie-build program. Also ready path can be downloaded from the Internet.
- (a dash at the end of the second line) means output to standard output for transfer to the samtools program, which converts it to .bam on the fly.
In the description, I missed the parameters --best --strata, which set a special bowtie mode: if the program finds more than one occurrence of a read in the genome with a different number of errors, then it displays the result with the least error. If the results with the least error are more than one, they are not displayed. This increases the time of the program, but at the same time allows to increase the sensitivity of the reads in the genome. Here is an example of the output of the .sam / .bam file:
@HD VN:1.0 SO:unsorted @SQ SN:chr10 LN:135374737 @SQ SN:chr11 LN:134452384 … @PG ID:Bowtie VN:0.12.7 CL:"/usr/src/bowtie-0.12.7/bowtie -q -v 1 -m 1 --best --strata -p 8 -S" USI-EAS21_8_3445_7_1_452_540 0 chr5 39195556 255 23M * 0 0 CTCCAGATTCTCTGGAAAGATGG SSSSSSPSSSSSSSSGNNSJSSL XA:i:0 MD:Z:23 NM:i:0 USI-EAS21_8_3445_7_1_170_242 0 chr14 73509925 255 23M * 0 0 CTGCATTAGACCTAGGCTTAGAA SSSSSSSSSSSSSSSSSSSGSNN XA:i:0 MD:Z:23 NM:i:0 USI-EAS21_8_3445_7_1_290_985 0 chr7 142613233 255 23M * 0 0 AGCTGACTGGCAAGCAACAGAGT JSSSSSSSSSSSPSSGSSLSNSL XA:i:0 MD:Z:23 NM:i:0 USI-EAS21_8_3445_7_1_881_711 4 * 0 0 * * 0 0 ATCGGAAGAGCTCGTATGCCGTC SSSSPSSSSSSSSSSSSSSSSNS XM:i:0 USI-EAS21_8_3445_7_1_897_318 0 chr3 50101427 255 23M * 0 0 GGGCGCAGAACCGCTGCTGCTGC SPSSSSSSSPPSSSSNSPPPLSL XA:i:1 MD:Z:15A7NM:i:1 ')
The header (lines starting with @SQ, @HD, @PG) contains descriptions: the names of chromosomes and their lengths, whether the file is sorted, the command with which the file was received. The body consists of lines, each line is read, but with coordinates in the genome. More details can be found here http://genome.sph.umich.edu/wiki/SAM .
Genome distribution is different, but in enriched areas, it is considered that the experiment is more likely to succeed if the distribution has the following properties: even coverage (high coverage), high complexity (high complexity), continuity of coverage (continuous coverage). Examples, as reads can cover the genome, are depicted in the figures above.
To determine the enriched areas, we use the following reasoning. We add all the lengths of the chromosomes and subtract the length of the repeating sections (approximate length 2282603114 for hg19), we take the resulting length in G. We divide the length G into windows of width W (for example, 500). We take for N the number of the resulting windows (G / W approximately 4565206.228). Let's count the number of reads in the experiment that were successfully found in the genome (let it be 4E6 out of 4.5E6), we take their number as S. Then the average number of reads per window, we denote
, will be = S * W / G = S / N.Poisson distribution
expresses the probability of the origin of a given number k of events over a period of time with a known average origin of events. The cumulative Poisson distribution will express the probability of occurrence of events of up to k. We will use the cumulative distribution, since we are interested in the probability that the number of reads in the window is less than k. Null hypothesis: k reads in a window by accident. Alternative hypothesis: k reads in the window is not accidental. The probability that our null hypothesis is true is even . The closer P (k, ) to 0, the less likely that the reads hit the specified window by accident. In our example, we obtain that if the number of reads in the window is up to 15, then 1-P (15.0.876193) = 2.55351E-15, i.e. The number of reads up to 15 can enter a window 500 wide by chance with a probability of 2.55351E-15. This number is also called p value. Consequently, if there are more than 15 reads, then they are even less likely to enter the window by accident. Thus, in the program, you can set the condition: if p value <= 1.e16, then the data in the window should be left for consideration, the rest should be discarded.Below is an example of a program that uses part of the classes described in the previous article , and is complemented by a new class of PoissonHandler. Additional files to the first archive can be downloaded here . In the new poisson directory, type qmake, then make. The assembled poisson program builds a significance table for 500bp windows located behind the transcriptional start site of each gene, the annotation is selected from the browser's genes. A more detailed work with the genome browser will consider in another article. Next, reads from the .bam file that fall into our windows are selected, a Poisson distribution is built for them. The result is written to the file.
PoissonHandler.hpp
#ifndef PoissonHandler_H #define PoissonHandler_H #include <config.hpp> class PoissonHandler : public QState { Q_OBJECT private: GenomeDescription *sql_input; GenomeDescription *sam_input; QSettings setup; public: PoissonHandler(GenomeDescription *sql,GenomeDescription *sam,HandledData &output,QState *parent=0); ~PoissonHandler(); protected: virtual void onEntry(QEvent* event); }; #endif // PoissonHandler.cpp
#include "PoissonHandler.hpp" //------------------------------------------------------------- //------------------------------------------------------------- PoissonHandler::~PoissonHandler() { } //------------------------------------------------------------- //------------------------------------------------------------- PoissonHandler::PoissonHandler(GenomeDescription *sql,GenomeDescription *sam,HandledData &,QState * parent): QState(parent), sql_input(sql), sam_input(sam) { } //------------------------------------------------------------- //------------------------------------------------------------- void PoissonHandler::onEntry(QEvent*) { if(!setup.contains("AvgTagWindow")) setup.setValue("AvgTagWindow",500); if(!setup.contains("siteShift")) setup.setValue("siteShift",75); qint32 window=setup.value("AvgTagWindow").toInt(); qint32 half_window=0;//window/2; qint32 shift=setup.value("siteShift").toInt(); int c=0;//sense count, even/odd c sense/nonsense QMap<QString,int> poisson; QMapIterator<QChar,QMap<QString,QMap<qint32,qint32> > > sense(sql_input->genome); while(sense.hasNext()) { sense.next(); c++; QMapIterator<QString,QMap<qint32,qint32> > dictionary(sense.value()); while(dictionary.hasNext()) { dictionary.next(); QMapIterator<qint32,qint32> s(dictionary.value()); //sql result for strand+chromosome if((sam_input->genome['+']).contains(dictionary.key())) //chromosome chr1,chr2... { QMapIterator<qint32,qint32> k( (sam_input->genome['+'])[dictionary.key()] );//+ strand,sam file, iteration over strand+chromosome s.next(); //c++; k.next(); while (k.hasNext()) // + strand, iteration over strand+chromosome+each position { //if align is inside of the segment of the start site qint32 x1=k.key()- s.key() +half_window +shift; qint32 x2=x1-window; if( (x1^x2) < 0 ) {//inside segment poisson[((sql_input->genome_h[sense.key()])[dictionary.key()])[s.key()]]+=k.value(); k.next(); } else { if((k.key() +shift)>(s.key()+half_window)) { if(!s.hasNext()) break; s.next();// c++; } else { k.next(); } } }//while k.hasNext }//if + strand sam input if((sam_input->genome['-']).contains(dictionary.key())) { QMapIterator<qint32,qint32> j( (sam_input->genome['-'])[dictionary.key()] );//- strand,sam file s.toFront(); s.next(); j.next(); while (j.hasNext()) // - strand { //if align is inside of the segment of the start site qint32 x1=j.key()- s.key() +half_window -shift; qint32 x2=x1-window; if( (x1^x2) < 0 ) {//inside segment poisson[((sql_input->genome_h[sense.key()])[dictionary.key()])[s.key()]]+=j.value(); j.next(); } else { if((j.key() -shift)>(s.key()+half_window)) { if(!s.hasNext()) break; s.next(); } else { j.next(); } } } }//if - strand sam file }//while dictionary }//while sense //Poisson { qreal lamda=(qreal)(window*(sam_input->total-sam_input->notAligned))/(sam_input->tot_len*0.741); QFile _outFile; _outFile.setFileName(setup.value("outFileName").toString()); _outFile.open(QIODevice::WriteOnly|QIODevice::Truncate); qreal exp_l=qExp(-lamda); QString str; foreach(str,poisson.keys()) { //P(x,L)=(e**-1)*(L**x)/x! // qreal pois=exp_l; //qExp(-lamda)*qPow(lamda,poisson[str]); // for(int i=2; i<= poisson[str];i++) // pois=pois*lamda/i; //P(x,L)=(e**-1)*E(1-k)(L**x(i))/x(i)! qreal pois=exp_l; qreal delim=1.0; qreal sum=1.0; for(int i=1; i<= poisson[str];i++) { delim*=lamda/i; sum+=delim; } pois*=sum; _outFile.write( (QString("%1\t%2\t%3\n").arg(str).arg(poisson[str]).arg(pois,0,'e',20)).toLocal8Bit() ); } _outFile.flush(); _outFile.close(); }//if(1) }//end of function //------------------------------------------------------------- //------------------------------------------------------------- These small algorithms will later be useful for implementing more complex ones, such as ZINBA or SICER , for example. We will talk about them in another article. Often the task is to find enriched areas without using annotations. And then step by step, you need to select data that fell into the window and passed through the filter.
Comprehensive comparative analysis of strand-specific RNA sequencing methods
Nat Methods. 2010 September; 7 (9): 709-715.
Joshua Z. Levin, 1,6 Moran Yassour, 1,2,3,6 Xian Adiconis, 1 Chad Nusbaum, 1 Dawn Anne Thompson, 1 Nir Friedman, 3,4 Andreas Gnirke, 1 and Aviv Regev1,2,5
www.ncbi.nlm.nih.gov/pmc/articles/PMC3005310
Genomic Location Analysis by ChIP-Seq
J Cell Biochem. 2009 May 1; 107 (1): 11-8.
Artem Barski * and Keji Zhao *
Laboratory of Molecular Immunology, National Heart, Lung and Blood Institute, NIH, Bethesda, MD 20892
www.ncbi.nlm.nih.gov/pubmed/19173299
An integrated strategy for the next-generation sequencing data.
Genome Biol. 2011 Jul 25; 12 (7): 120.
Peng W, Zhao K.
Department of Physics, The George Washington University, 725 21st Street NW, Washington, DC 20052, USA. wpeng@gwu.edu
www.ncbi.nlm.nih.gov/pubmed/21787381
A clustering approach for identification of enriched domains from histone modification ChIP-Seq data.
Bioinformatics. 2009 Aug 1; 25 (15): 1952-8. Epub 2009 Jun 8.
Zang C, Schones DE, Zeng C, Cui K, Zhao K, Peng W.
Department of Physics, The George Washington University, Washington, DC 20052, USA.
www.ncbi.nlm.nih.gov/pubmed/19505939
ZINBA integrates local covariates with DNA-seq data, even within amplified genomic regions.
Genome Biol. 2011 Jul 25; 12 (7): R67.
Rashid NU, Giresi PG, Ibrahim JG, Sun W, Lieb JD.
Department of Biostatistics, Gillings School of Global Public Health, The University of North Carolina at Chapel Hill, Chapel Hill, NC 27599, USA.
www.ncbi.nlm.nih.gov/pubmed/21787385
Review by Andrey Kartashov, Cincinnati OH, mail: porter@porter.st
Source: https://habr.com/ru/post/137267/
All Articles