Graph of user relations Google+. Gephi
After reading the Gephi article as a data visualization tool, I was under a strong impression of the Gephi program. At that time I was engaged in the generation of user activity logs on Google+ . And I got an idea, and maybe make a graph of the relationship between the participants of the social. Google+ networks. After several hours of searching, I came to the conclusion that such things had not yet been done for Gephi. Even on wiki gephi, the graph generation algorithm for Google+ is not suggested. And in the wake of inspiration, I quickly added in the LoggenCSG application a log upload module to the sqlite database file that Gephi can import. The results of the import graph in Gephi I really liked.
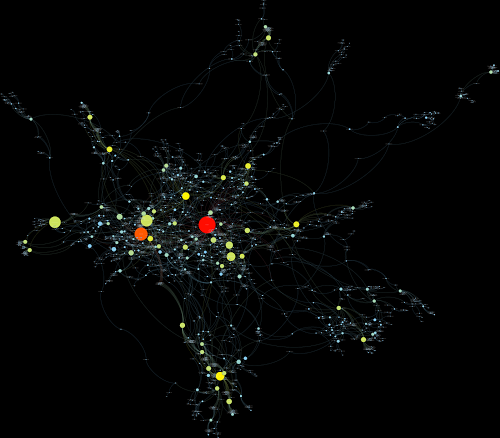
Indirect relationships between users through their activities.
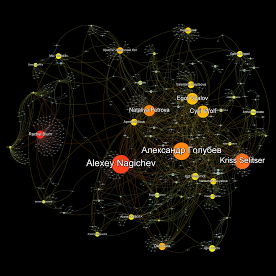
Direct communication between users through their activities.
Next comes a description of how to build such graphs on your own.

You can find it by going to your profile . The address bar will have something like https://plus.google.com/u/0/ 101113754039426612780 / posts .
After you insert Id. It is necessary to choose the maximum amount of the last posts of the user.

We specify it in the first counter. Secondly, the number of comments, and accordingly, the authors who left them. Then the maximum number of results for the pros and solvers, respectively, 3 and 4 counter.
You can also select a tick deep search . This parameter is responsible for the data sampling algorithm. If the parameter is enabled, the specified number of the last user's message will be received first (by whose Uid the activity log is generated), after which the authota of the activities will be detected. Then, for each identified author, a classical algorithm is triggered: by his uid, the specified number of recent posts is obtained and the analysis of activities is carried out. A deep algorithm is needed to obtain a more general picture of the relation, but it is more expensive than the classical one.
You can choose for which visualizers logs will be made. And specify the files in which they should be saved.


Each visualizer has its own set of templates. But we are interested in the column Gephi. The default template is for all {type} files : {title} :
If we generate data on this template, we get a graph of indirect relations between users, that is, there will be a graph where the user (author) goes edge to his post, and from another user (commentator) to the activity he has shown in relation to the post. Between fasting and activity, a rib is also formed. As a result, we get connections between users through their activities.
')
To get a different picture, namely, to obtain non-mediocre connections between the user, you need to change the templates for all file types to {actorname} :
After all the settings, click the Generate button. The program will open the default browser to authorize the application through OAuth2, in order to have your authority to receive information. How this is done is the code . I took not very cunning from Google from their examples .
Working with the database is carried out through the System.Data.SQLite provider using Linq to Entities technology. Here is the GephiAppender class. It seems all data is now they need to be processed in gephi.
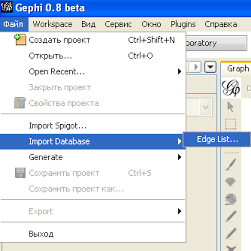
After starting the program, select File-> Import Database-> Edge list ...
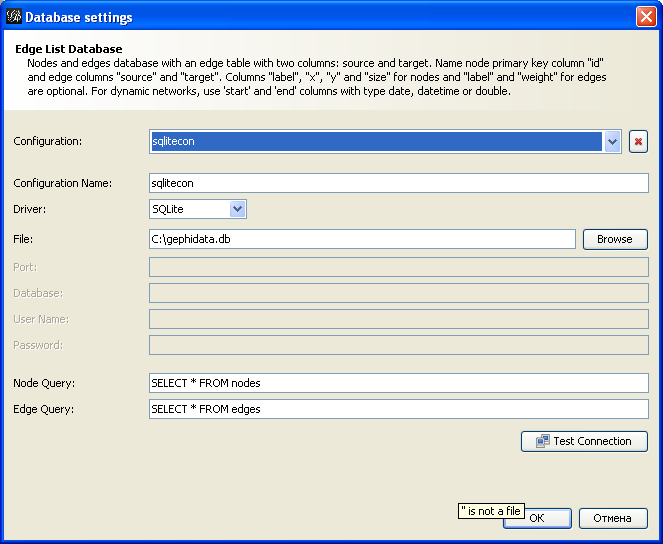
In the dialog box, select dirver sqlite, fill in the fields that it highlights in red, in the file name field, select the generated LoggenCSG db file. In my case by default.
After processing, we obtain the following result:

Here we see that 2019 vertices, 5891 edges, the graph are imported dynamically. Click OK. At the bottom left, select the algorithm for processing the layout . I chose ForceAtlas 2 . Set Scaling (Scaling) to the value 30. Click Run .
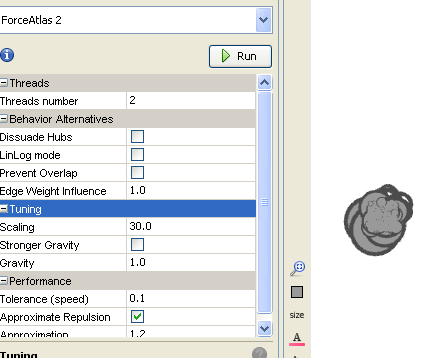
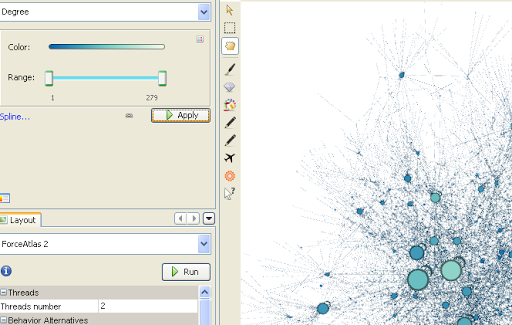
We are waiting for the most pleasant result for you. Move up and select the Degree method from the list, we will color the vertices and the edges associated with them according to their weight. We create the gradient we need or select a ready-made palette in the corner from the right. Click Apply .
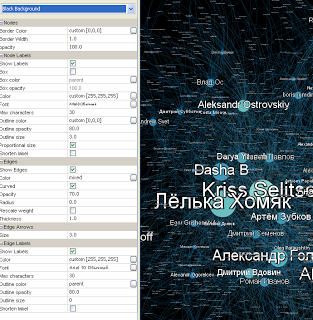
After that go to the Preview tab. Configure everything as in the picture and click Refresh .
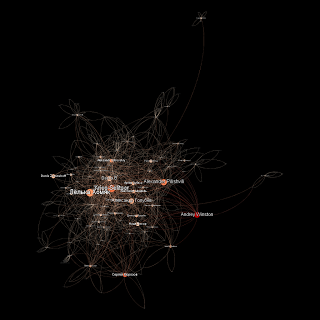
We return to the Overwrite tab. Bottom right filter palette. We select from the list the Topology-> Ego Network catalog (Links relative to a particular vertex. Well, literally, Ego network =). Drag this filter to the area below. Go to the Data tab ... In the upper right corner there is a filter, enter the name we need. I entered Kriss. Copy or memorize id. Go back and specify it in the Node Id field. Click Filter .
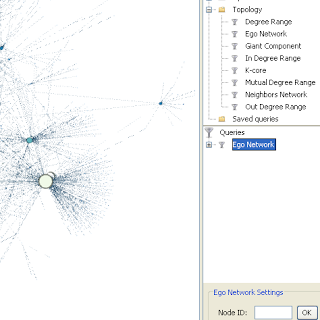
The value that can be selected under the Node Id field indicates the number of steps from the selected vertex to the next, default is 1. When using this filter, we see how many users are within one step from Kriss.

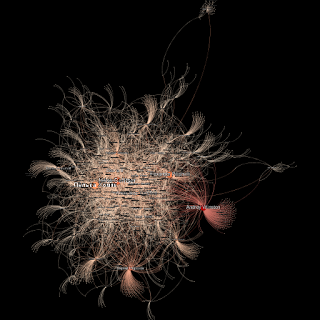
Then you can choose a valid Mutual Degree Range filter, it allows you to see the mutual connections between all the vertices. Drag it to the lower area and move the slider from 0 to 1, we see all users who have mutual connections from 1 to max.
Here is a map to:
But after applying the filter:
Filters can also be combined. Just drag one filter to another.
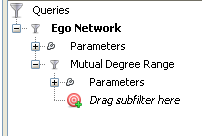
We get Ego network with mutual relations. Here is the result of applying this filter to the previous picture before:
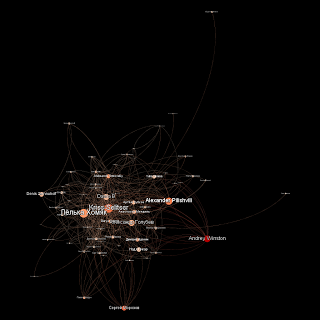
This is a very interesting exercise to analyze the mutual relations between users. =) I hope you enjoy it.
As it turned out, Gephi is a very powerful tool for working with graphs. It has a clear interface. Allows you to see the graph in dynamics, this is what I did not say. Since the graph generated by LoggenCSG is dynamic, a dynamic filter can be applied to it, and if any of the methods for constructing the layout are included, a very nice picture is obtained.
Habralyudy who will study the source code sorry for the lack of comments in the code.
Pictures are not of greater resolution, as only to demonstrate the result which is visible immediately and without details. You can see in details in my album here with this card , there is a caption for the picture.
PS : Yes, and these graphs demonstrate really active users in your circles.
Thank you all for your attention.
Indirect relationships between users through their activities.

Direct communication between users through their activities.

Next comes a description of how to build such graphs on your own.
Software
In order to get a similar result, we need 2 programs:- Gephi is a great tool for building and analyzing graphs.
- LoggenCSG - program for generating user activity logs on Google+
Vocabulary
- Post - a message posted by the user in his profile.
- Repost - a message that the user has reposted from another user to his tape.
- Plus - the voice (rating) post user.
- Reshara - repost by another user post (repost) user.
- Activity - any public action of the above.
- Attitude - communication between users through their activities.
Work with LoggenCSG
After starting the program, you need to insert a user ID in Google+ in the Profile Id field.
You can find it by going to your profile . The address bar will have something like https://plus.google.com/u/0/ 101113754039426612780 / posts .
After you insert Id. It is necessary to choose the maximum amount of the last posts of the user.

We specify it in the first counter. Secondly, the number of comments, and accordingly, the authors who left them. Then the maximum number of results for the pros and solvers, respectively, 3 and 4 counter.
You can also select a tick deep search . This parameter is responsible for the data sampling algorithm. If the parameter is enabled, the specified number of the last user's message will be received first (by whose Uid the activity log is generated), after which the authota of the activities will be detected. Then, for each identified author, a classical algorithm is triggered: by his uid, the specified number of recent posts is obtained and the analysis of activities is carried out. A deep algorithm is needed to obtain a more general picture of the relation, but it is more expensive than the classical one.
You can choose for which visualizers logs will be made. And specify the files in which they should be saved.

File name patterns.
The most interesting part is the formation of file name generation patterns.
Each visualizer has its own set of templates. But we are interested in the column Gephi. The default template is for all {type} files : {title} :
- {type} - type of activity (post, plus, reshare, share, comment)
- {title} - 100 first characters from the message text, or a full message if it is shorter than 100 characters.
If we generate data on this template, we get a graph of indirect relations between users, that is, there will be a graph where the user (author) goes edge to his post, and from another user (commentator) to the activity he has shown in relation to the post. Between fasting and activity, a rib is also formed. As a result, we get connections between users through their activities.

')
To get a different picture, namely, to obtain non-mediocre connections between the user, you need to change the templates for all file types to {actorname} :
- {actorname} - the name of the user who performs the activity.
- Date and time of activity.
- The author of the activity.
- File name.
- And the type of activity (takes the values M or A is for visualizers).
- For gephi, the From parameter is still passed (that is, from whom the activity is coming, for pluses, the decision and the full file name of the post is passed to comments. {Postfilename})

After all the settings, click the Generate button. The program will open the default browser to authorize the application through OAuth2, in order to have your authority to receive information. How this is done is the code . I took not very cunning from Google from their examples .
How to add data to the database.
The algorithm is as follows:- If the top of the source (passed into the activity author) does not exist, add it, otherwise increase its Size parameter by one.
- If the target node (the file name passed) does not exist, add it, otherwise, increment the Size counter by one.
- If the edge source is a receiver, we essentially increase its Size parameter by one, otherwise we create an edge.
- If the from parameter is not empty, we form a new source vertex, if it exists we increase the Size, otherwise we add a new one.
- Check whether there is a connection between the target vertex and the new source. there is an increase in Size, otherwise create.
Working with the database is carried out through the System.Data.SQLite provider using Linq to Entities technology. Here is the GephiAppender class. It seems all data is now they need to be processed in gephi.
Work with Gephi
The source code on which the example is made. Data generated by Kriss Selitser profile.
After starting the program, select File-> Import Database-> Edge list ...

In the dialog box, select dirver sqlite, fill in the fields that it highlights in red, in the file name field, select the generated LoggenCSG db file. In my case by default.

After processing, we obtain the following result:

Here we see that 2019 vertices, 5891 edges, the graph are imported dynamically. Click OK. At the bottom left, select the algorithm for processing the layout . I chose ForceAtlas 2 . Set Scaling (Scaling) to the value 30. Click Run .

We are waiting for the most pleasant result for you. Move up and select the Degree method from the list, we will color the vertices and the edges associated with them according to their weight. We create the gradient we need or select a ready-made palette in the corner from the right. Click Apply .

After that go to the Preview tab. Configure everything as in the picture and click Refresh .

We return to the Overwrite tab. Bottom right filter palette. We select from the list the Topology-> Ego Network catalog (Links relative to a particular vertex. Well, literally, Ego network =). Drag this filter to the area below. Go to the Data tab ... In the upper right corner there is a filter, enter the name we need. I entered Kriss. Copy or memorize id. Go back and specify it in the Node Id field. Click Filter .

The value that can be selected under the Node Id field indicates the number of steps from the selected vertex to the next, default is 1. When using this filter, we see how many users are within one step from Kriss.

Then you can choose a valid Mutual Degree Range filter, it allows you to see the mutual connections between all the vertices. Drag it to the lower area and move the slider from 0 to 1, we see all users who have mutual connections from 1 to max.
Here is a map to:

But after applying the filter:

Filters can also be combined. Just drag one filter to another.

We get Ego network with mutual relations. Here is the result of applying this filter to the previous picture before:

Conclusion
I hope you figure it all out. If it is too flowery written sorry.This is a very interesting exercise to analyze the mutual relations between users. =) I hope you enjoy it.
As it turned out, Gephi is a very powerful tool for working with graphs. It has a clear interface. Allows you to see the graph in dynamics, this is what I did not say. Since the graph generated by LoggenCSG is dynamic, a dynamic filter can be applied to it, and if any of the methods for constructing the layout are included, a very nice picture is obtained.
Habralyudy who will study the source code sorry for the lack of comments in the code.
Pictures are not of greater resolution, as only to demonstrate the result which is visible immediately and without details. You can see in details in my album here with this card , there is a caption for the picture.
PS : Yes, and these graphs demonstrate really active users in your circles.
Thank you all for your attention.
UPD
Results for different users.Source: https://habr.com/ru/post/137022/
All Articles