Gephi as a data visualization tool
It so happened that I was an assistant professor at the university. I never thought that I would have to face risk assessment and data visualization, being, by vocation, a cryptographer. The course is called “Information Networks” and includes: analysis of random processes, modeling of small worlds; computer algorithms for evaluating network properties; experimental studies of large networks; and risk analysis that are difficult to predict.
In view of the fact that the course is taught mainly for IT students, the lecturer made a bid to give enough theory with a minimum of mathematics and a lot of practice. For most of the above tasks, NetLogo is suitable. It includes its own high-level programming language, which makes it easy to simulate various random processes. To visualize a variety of data was selected program Gephi .
Based on the experience of using the latter, an article was written in which the acquisition of input data for software with its subsequent visualization is considered.
')
The actual formulation of the problem was such: visualization of any real data using Gephi tools.
After some reflection I decided to present the interaction of the authors from the IACR site. Those who work in the field of information security probably know about it, for everyone else - this is a site where articles on information security are presented in open access.
Gephi understands a fairly large number of file formats.

As you can see from the figure, the best option is to use gexf . As it turned out, this is an open format and the library can be easily downloaded from here . The site says that Libgexf currently only works on Linux (tested in Ubuntu 8.10 and 9.04). Without hesitation, I decided to download the source code and compile it under Ubuntu 11.10 with interfaces for Python (since I decided to implement the rest of it on it). I generated a test file and decided to launch it in Gephi, but with its help neither my file, nor the ones downloaded from the Internet, nor even the one that saved itself were opened. I don’t know what the bug is, but, having picked it up a bit and tried it on two machines, I decided to give up this idea and look for an alternative. After playing with CSV and I realized that its functionality was not enough, I came across import from the database.
It can be found in the “File -> Import Database -> Edge list ...”. At first, I thought that the “Edge list” was just a rib import, but it turned out that vertices were also imported. SQLite, MySQL, PostgreSQL, and Teradata can be used as databases. In the import window, on top there is a hint to the parameters of the tables. There should be two tables: nodes and edges. The nodes table should contain columns:
For the edges table, the columns are as follows:
Optional columns "start" and "end" for dynamic graphs. After several test checks, it was decided to use SQLite3.
The script (program) should do the following:
In view of the fact that the source code is quite a lot, I did not embed it in the article. Download it here .
I will cite just a few comments. As a database, sqlite3 was used, whose interface support is present in python. Tables and columns are created as described in the “File Formats” section. “Https: //eprint.iacr.org/cgi-bin/cite.pl? Entry = year / number” was used as the original link, where year is the year of publication, number is the article number. Initially it was supposed to go through from 001 to the last, which is determined by the absence of the word “author”. However, it later turned out that not all article numbers are present (for example, no 001 in 2004). Therefore it was necessary to pile up a bicycle for checking 3 consecutive not found authors. Another one was waiting for a trick when receiving a full name. Authors' lines can be:
"{Elena Prekrasnaya, Tugarin Snake and Alyosha Popovich}"
"{Elena Prekrasnaya, Tugarin Snake, and Alyosha Popovich}"
"{Elena Prekrasnaya, Tugarin Snake, and Al {ee} Sha Popovich}"
"{Alyosha Popovich }"
"{Helen the Beautiful and the Tugarin Snake}"
Someone tell me how quickly to get the full name from the lines, I will be grateful. The output should be ['Elena Prekrasnaya', 'Tugarin Snake', 'Alyosha Popovich']] (without spaces and commas, that is, just the first and last name through the space).
And finally, in order not to torture the Internet, I decided to first create a local dump of the authors, and then use it as input. For this, I used pickle , which allows you to dump variables into a file, and then, if necessary, extract. For this, I created a dictionary. The keys were the year, and the values are an array of strings with the authors. Thus, I can create a database for the years of interest to me, using only a local file .
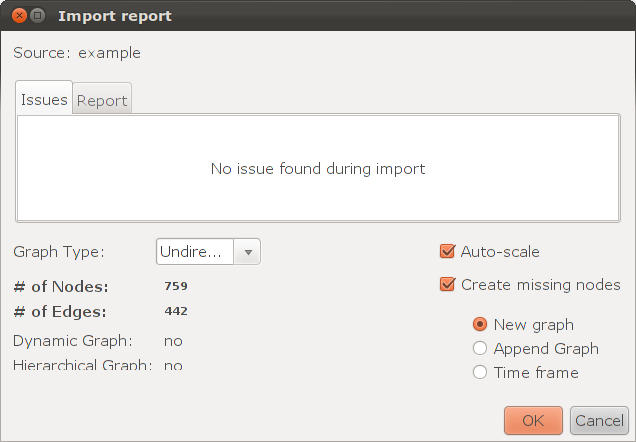
As an example, take a small graph : the years from 1996 to 2003. It consists of 759 vertices and 437 edges. This information can be seen when importing the graph:
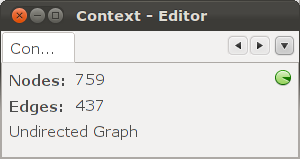
or in the Context window.
Additionally, when importing, you can choose the orientation of the graph: oriented, non-oriented, or mixed.
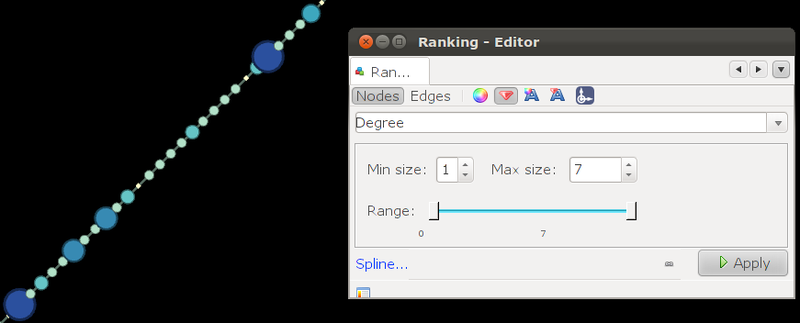
Next, select the window "Ranking" for the initial editing of the graph. Depending on the degree, let's color all the vertices in shades of blue and set the size of the vertex itself. I recommend to set the maximum size of the vertex equal to the maximum degree of the vertex or 2 times larger.
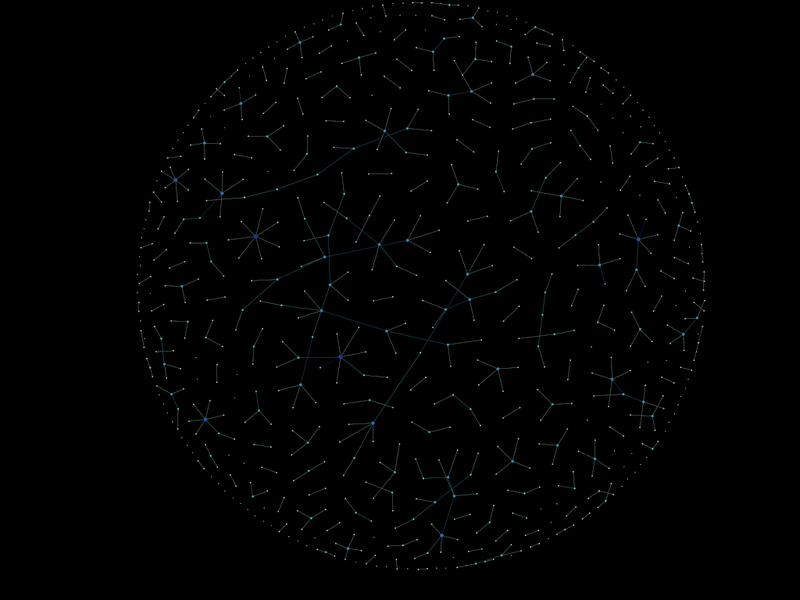
In the end, this is what happened:
Now, in order to present everything beautifully, we will select the “Layout” window. This window presents the algorithms that can be used to organize the graph.
The following are screenshots of some of them.
ARF
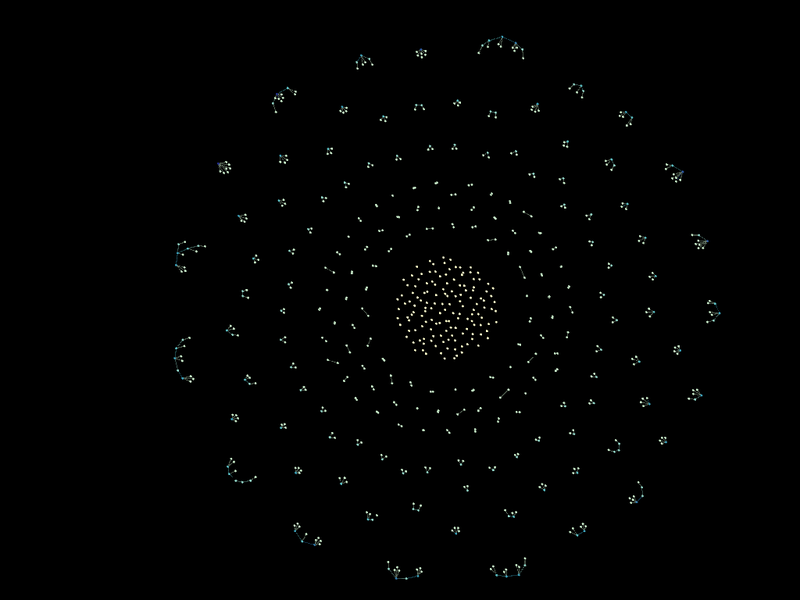
Radial axis

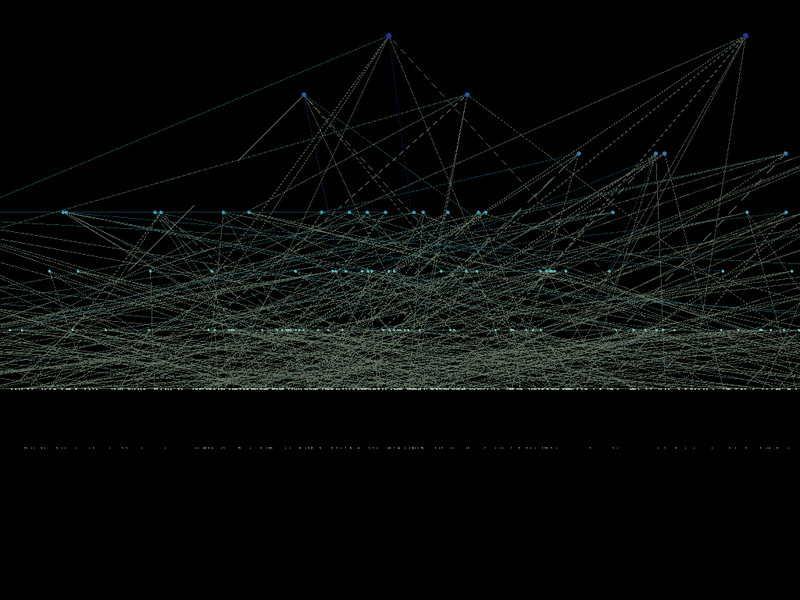
Parallel Force Atlas
More vertices can be attached to one of the axes, however this is selected in the window “Ranking” -> “Coordinates”
On the graph, you can choose to display the field «label». For example:

Gephi is a young but very powerful tool for visualizing various data, which is suitable for both novice and experienced users. Using databases allows you to quickly and easily obtain the necessary input data for visualization.
In view of the fact that the course is taught mainly for IT students, the lecturer made a bid to give enough theory with a minimum of mathematics and a lot of practice. For most of the above tasks, NetLogo is suitable. It includes its own high-level programming language, which makes it easy to simulate various random processes. To visualize a variety of data was selected program Gephi .
Based on the experience of using the latter, an article was written in which the acquisition of input data for software with its subsequent visualization is considered.
')
The actual formulation of the problem was such: visualization of any real data using Gephi tools.
Data generation
After some reflection I decided to present the interaction of the authors from the IACR site. Those who work in the field of information security probably know about it, for everyone else - this is a site where articles on information security are presented in open access.
Gephi File Formats
Gephi understands a fairly large number of file formats.
As you can see from the figure, the best option is to use gexf . As it turned out, this is an open format and the library can be easily downloaded from here . The site says that Libgexf currently only works on Linux (tested in Ubuntu 8.10 and 9.04). Without hesitation, I decided to download the source code and compile it under Ubuntu 11.10 with interfaces for Python (since I decided to implement the rest of it on it). I generated a test file and decided to launch it in Gephi, but with its help neither my file, nor the ones downloaded from the Internet, nor even the one that saved itself were opened. I don’t know what the bug is, but, having picked it up a bit and tried it on two machines, I decided to give up this idea and look for an alternative. After playing with CSV and I realized that its functionality was not enough, I came across import from the database.
It can be found in the “File -> Import Database -> Edge list ...”. At first, I thought that the “Edge list” was just a rib import, but it turned out that vertices were also imported. SQLite, MySQL, PostgreSQL, and Teradata can be used as databases. In the import window, on top there is a hint to the parameters of the tables. There should be two tables: nodes and edges. The nodes table should contain columns:
- Required:
- id - vertex number
- not necessary:
- label - mark or mark the vertex
- x - x coordinate on the plane where the vertex of the graph will be located
- y - y coordinate on the plane where the vertex of the graph will be located
- size - the size of the vertex
For the edges table, the columns are as follows:
- required:
- source - the id of the initial vertex
- target - the id of the final vertex
- optional:
- label - marking or marking the edge
- weight - edge weight
Optional columns "start" and "end" for dynamic graphs. After several test checks, it was decided to use SQLite3.
Script database filling in Python
The script (program) should do the following:
- Download data about the authors of the article
- Separate information about authors into individual names
- Fill in the database in accordance with the previous paragraph
In view of the fact that the source code is quite a lot, I did not embed it in the article. Download it here .
I will cite just a few comments. As a database, sqlite3 was used, whose interface support is present in python. Tables and columns are created as described in the “File Formats” section. “Https: //eprint.iacr.org/cgi-bin/cite.pl? Entry = year / number” was used as the original link, where year is the year of publication, number is the article number. Initially it was supposed to go through from 001 to the last, which is determined by the absence of the word “author”. However, it later turned out that not all article numbers are present (for example, no 001 in 2004). Therefore it was necessary to pile up a bicycle for checking 3 consecutive not found authors. Another one was waiting for a trick when receiving a full name. Authors' lines can be:
"{Elena Prekrasnaya, Tugarin Snake and Alyosha Popovich}"
"{Elena Prekrasnaya, Tugarin Snake, and Alyosha Popovich}"
"{Elena Prekrasnaya, Tugarin Snake, and Al {ee} Sha Popovich}"
"{Alyosha Popovich }"
"{Helen the Beautiful and the Tugarin Snake}"
Someone tell me how quickly to get the full name from the lines, I will be grateful. The output should be ['Elena Prekrasnaya', 'Tugarin Snake', 'Alyosha Popovich']] (without spaces and commas, that is, just the first and last name through the space).
And finally, in order not to torture the Internet, I decided to first create a local dump of the authors, and then use it as input. For this, I used pickle , which allows you to dump variables into a file, and then, if necessary, extract. For this, I created a dictionary. The keys were the year, and the values are an array of strings with the authors. Thus, I can create a database for the years of interest to me, using only a local file .
Data Visualization with Gephi
As an example, take a small graph : the years from 1996 to 2003. It consists of 759 vertices and 437 edges. This information can be seen when importing the graph:
or in the Context window.
Additionally, when importing, you can choose the orientation of the graph: oriented, non-oriented, or mixed.
Next, select the window "Ranking" for the initial editing of the graph. Depending on the degree, let's color all the vertices in shades of blue and set the size of the vertex itself. I recommend to set the maximum size of the vertex equal to the maximum degree of the vertex or 2 times larger.
In the end, this is what happened:
Now, in order to present everything beautifully, we will select the “Layout” window. This window presents the algorithms that can be used to organize the graph.
The following are screenshots of some of them.
ARF
Radial axis
Parallel Force Atlas
More vertices can be attached to one of the axes, however this is selected in the window “Ranking” -> “Coordinates”
On the graph, you can choose to display the field «label». For example:
findings
Gephi is a young but very powerful tool for visualizing various data, which is suitable for both novice and experienced users. Using databases allows you to quickly and easily obtain the necessary input data for visualization.
Source: https://habr.com/ru/post/136575/
All Articles