Analysis of the use of SPA-applications using Google Analytics
In this topic, I want to describe my experience about screwing Google Analytics to a web application built on the principle of a single-page application .
Before performing this task, I was very remotely aware of what Google Analytics is and why it is eaten. For this reason, I also want to talk about how I understood Google Analytics, killing many hours of time. I hope this squeeze will help those who are starting to get acquainted with this analytics system.
The task itself is also a bit non-standard, and the experience of “crossing a hedgehog with a snake” can be useful to someone.
So,
The application whose use has been analyzed is a SaaS application for collaboration and project management. The application has the following registration scheme - you can create an account with one click from the main site, and then you can register this account by giving it a URL and entering the login details. Such a scheme was invented so that potential customers could familiarize themselves with the system without entering any data - i.e. we do not shun lazy and paranoid as clients.
It is clear that such a single-click account (we call it anonymous) has its limitations, the most significant of which is the lack of a dedicated URL (identification is carried out using cookies). As a result, only one user can work in such an account, and while others can be created, they will not be able to log in.
If someone wants to get acquainted with the system more closely, he is offered to register an account. When registering, the URL and e-mail with a password to enter the system is indicated. It is also proposed to choose the estimated tariff plan or free single-user plan.
The task was to find out the reasons why people left the anonymous accounts without registering. These data are supposed to be used to improve the percentage of registrations.
Immediately make a reservation - when solving this problem, it was supposed to use "non-invasive" diagnostic methods All logout questionnaires were excluded.
Since we had no experience in solving such problems, the first idea that came to mind was to somehow record the work of users (ideally, to record video). By this record, you can try to understand what users are doing and why they are not registered.
Google showed us on Clicktale . According to the description, everything looks very nice: a certain javascript code is inserted, and all user actions begin to be recorded - mouse movements, clicks, and keyboard input.
The system allows you to build heatmaps (intensity maps of click distribution or mouse movements over pages - averaged over a bunch of users), build many different statistical graphs, and most importantly, play videos of specific visits!
But on closer inspection it turned out that not everything is so smooth. The system works as follows - coordinates of movements and clicks, and events of pressing on the keyboard are recorded. Then our site opens in the IFRAME and the recorded events are played back. However, this is not fundamentally supported by AjAX in general, although for the sake of fairness it must be said that the guys are working on this and are releasing plug-ins for typical AJAX-implementations.
In other words, the system is well suited for static sites. To fasten it to the web-application, especially SPA, it takes a lot of time and files.
We looked in the direction of commercial analytics systems - Totango , mixpanel , but they (logically) turned out to be sharpened specifically for site analytics - calculating all kinds of raits and efficiencies, but not analyzing application usage.
There were even crazy thoughts “to make something of their own”, however, we saw an interesting online utility for visualizing the paths of GAVisual users pulling data from Google Analytics, and realized that in this form it would be nice to see the data. This is not a video of the work of users, but at least the sequence of actions and place of care can be clearly seen. You do not need to manually shovel tens and hundreds of sessions. In the future, a similar feature appeared in the very interface of Google Analytics called Visitors Flow.
And, probably, the deciding factor was that Google Analytics was already bolted to the application.
')
Here, without pretending to anything, I will try to talk about how I understood Google Analytics in relation to our task. I say “applied” because the initial use of Google Analytics is to obtain statistical information about site visits and the “effectiveness of various marketing activities” ( quote ). In other words, the analysis of users' behavior on the site as the purpose of using Google Analytics is not considered, but is only a consequence of the universality of the platform. Further, the system is sharpened primarily for sites and not for applications. Below, I will tell you in more detail about what rakes came from this and how we stepped on them, but so far about the Google Analytics system itself.
For those who want to deal with analytics in general and Google Analytics in more detail, there are a lot of materials, for example, excellent articles at the beginning of a blog on web-analytics .
Hit (please do not find fault with the name) - a single request from the client browser with a loaded site / application to the statistics server. Hits are (mostly) of two types - PageView and Event. The first means that the client opened a certain page, the second - that something happened that was not connected with the opening of the page.
In the examples about the Event is often used "started playing the video," but it can be absolutely everything - moving the mouse, clicks, keyboard input, even the events on the timer.
The only way to trigger an event is to directly access GA using the API, while in order to track the PageView, it’s enough just to have the GA code on the page (it sends a hit itself after the page loads).
Interestingly, in GA, a hit is executed by a GET request to a GIF file, although it may seem logical to make a request to a web service. As far as I know, this is done for the sake of reducing traffic. It also affects the fact that no data should be received from the server. The hit transmits a lot of information - the visitor's ID and session, the URL of the page being opened, the name of the Event, the screen resolution, etc.
Visitor (Visitor) - a unique client who has visited the site. It is determined using cookies.
Visit (Seen) - a sequence of actions (= hits) of a certain client. Ends when the browser is closed or the 30-minute inactivity period expires. It is also tracked using cookies. As a programmer, it's easier for me to call this a “session.”
Those. Google Analytics, using its script, collects actions, sending hits to the server, and there it groups actions by visitors and by sessions.
Now how this data is presented in the Google Analytics interface
Account (Account) - is associated with google-account store hits. In one google-account there can be several analytics accounts. Different accounts, even within the same google-account, are completely isolated from each other. Within the account, users who have access to it are specified, filters that can be applied to the data (but which are not yet applied), and some other settings.
Web property - The top level of data accumulation in Google Analytics. Each resource has its own unique code that fits into the client script and is sent further along with each hit.
Profile (Profile) - a subset of data within a single resource. Each resource has at least one profile; In profiles, you can specify filters by which data is selected. It is important that the profiles are not built dynamically according to the resource. For example, if you create a new profile, the data collected before the profile is created will not appear in it.
Profile - the main "work unit". All statistics are calculated and all reports are built within one profile.
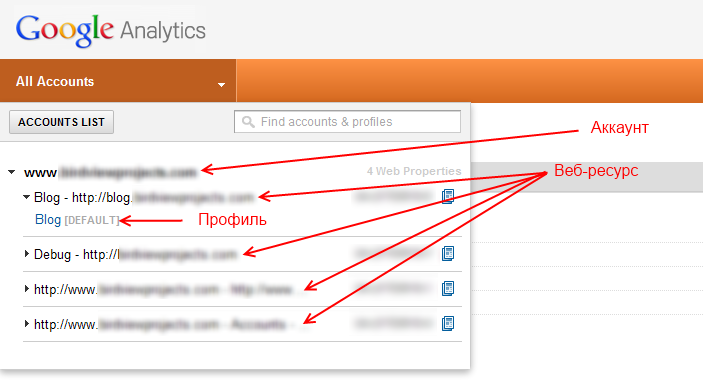
Advanced segment - a subset of data within a profile defined by filters. Unlike profiles, segments are built at once according to all profile data. Also, the data of different segments can be compared with each other (data of different profiles is impossible).
It's a shame that in the segments you can not filter on all fields. So, we wanted to kick off test traffic from the office, spoiling the statistics. I had to do it through the profile, and as a result, the previously collected data could not be “cleaned up”.
Based on the collected data, various indicators are calculated - the number of visitors per day / month / ..., the number of visits per day / month / ..., the ratio of new and returning visitors, the average time to view a page / stay on the site, the percentage of session completion on a specific page and many, many others.
In this form, statistics are of little use, since she knows nothing about our goals. Goals in Google Analytics can be specified as a page to be reached, as the minimum time spent on the site, the number of open pages per visit, or a fixed event. There are also “channel groups” that allow you to track the sequence of actions, but this is already aerobatics.
The main conclusion I made is that this analyst is good when you know exactly what you want from it :) We didn’t have that understanding, so we decided to just watch what the visitors are doing in the application using the report “Visitors flow”. Well, refer to the basic statistics, if you suddenly understand how to interpret it.
The very first problem we encountered was the following. The main “unit” of analysis in Google Analytics is the site page. Naturally, we have no pages in the application as such.
Fortunately, the application simply enough managed to allocate the analog page. I do not know how to give it a normal definition, but in most cases it was either a list of objects of a particular type in a particular form, or a screen with detailed information about a particular object. I suspect that something like this can be distinguished in any application.
To even greater happiness, the pages found a one-to-one correspondence in the client architecture of the application. Tracking the opening of the pages was just a matter of technology - the right code with an appeal to API GA in the right place (the only one!), And everything is ready. It was done once upon a time.
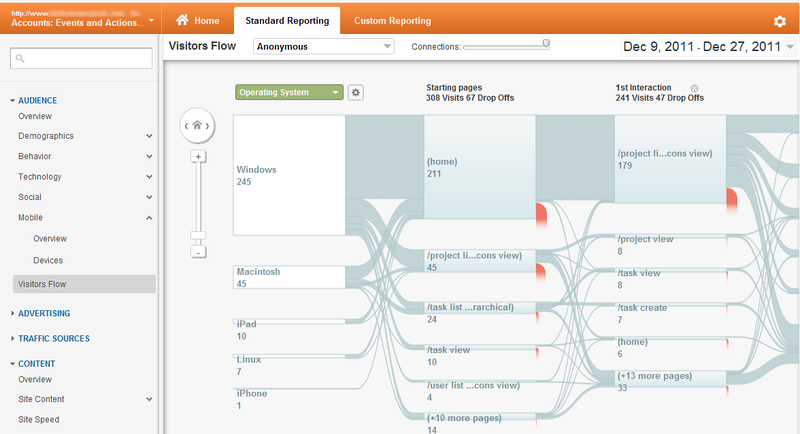
There should be a retreat. Initially, statistics were fastened "just in case", without any specific goals. And the very first rake on which we stepped on was that the menus and sidebars in the system were built on the basis of the same object as the pages. That is, when the system was loaded, the analytics code honestly sent three hits - in addition to the main page, they also opened the menu and sidebar. They reached Google for a race - you can imagine what it looked like in the Visitors flow:

In addition to porridge at the beginning of visits, we received almost zero percent of failures. A refusal is to visit only one page in a session, and we have “opened” three at once.
To remove the parasitic calls from the labor code was not made, although they did not return the months of the previously collected statistics.
Then it turned out that the application sent hits almost every time a user clicked. And these hits were Event type. Logically, do not send PageView. Despite the fact that the Events were more or less structured (there are three levels of hierarchy: category, action and label), all the Events are mixed, and we could not draw any sensible conclusions.
The biggest problem is that the events are not fixed in Visitors Flow, i.e. the sequence of events cannot be restored.
The events were conscientiously cleaned out of the application, leaving only the minimum necessary for the registration statistics.
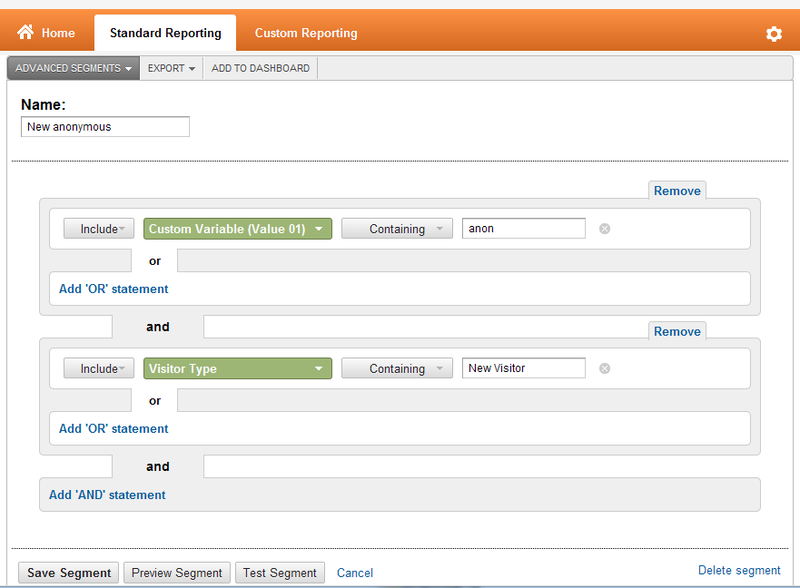
On the third, instead of the compote, they got the biggest problem - the visitors were not segmented. Returning to the goals - we need to track the behavior of newcomers who have just created an anonymous account. Google Analytics, of course, did not know anything about the sources of hits, and in one heap fell both beginners and experienced, and even those who have already bought. There was no sense to us from this heap.
Custom variables came to the rescue. Speaking primitively, up to 5 “name-value” pairs can be attached to a hit, which can then be used to filter data in Advanced segments. A line was added to the analytics code that sets the value of the variable to the account type (anonymous, trial, or purchased), and Advanced Segment is configured. In addition to the trial and purchased accounts, “returnees” were also rejected:
From the moment, everything was ready for collecting statistics. But our UX specialist put forward another requirement - the behavior of users on the registration page should be monitored in detail. Thankfully, they refused to track mouse movements (the analytics session is not rubber - a maximum of 500 hits), but the focus on the fields, button clicks, and keyboard input were necessary to track.
Events for this were not good - it was necessary to restore the sequence of actions. We decided to use PageView instead of events (forgive us the creators of Google Analytics). That is, the focus in the e-mail input field is as if opening the / register / emailfocus page, typing in the password field in the / register / passwordkeypress page, etc.
Technically, it turned out to be easy to implement this - the client API will allow to simulate the opening of pages, indicating the URL of the page. Moreover, it turned out that the analyst groups the same discoveries going in a row, considering them for one discovery. This has proven useful when tracking keyboard input.
The last requirement was to record the reason for the unsuccessful registration (blank fields, busy URL, etc.). It was done quite simply - a validation summary was added to the URL of the virtual page “opened” during unsuccessful registration. Received “open” pages of the register / submitinvalid / aliasistaken type.
After running the code and getting the first statistics, we were disappointed. Separately, the lost time was disappointing - the data in Analytics appears with a delay of several hours, so usually the result of changes is visible only the next day.
Actually the disappointment was that the path to the registration page and on the page itself was recorded as various visits. The reason for this was the implementation of the registration page - it was in a separate application displayed in the IFRAME (the reasons for this are not technical, but organizational, it was easier to divide the work). IFRAME displayed URLs in another subdomain, and analytical cookies, respectively, were not prolazily subdomain.
Google already has a ready-made solution for this situation. I will only note that _setAllowHash was not done, since it was not required to fumble cookies between the main domain and subdomains - only between subdomains.
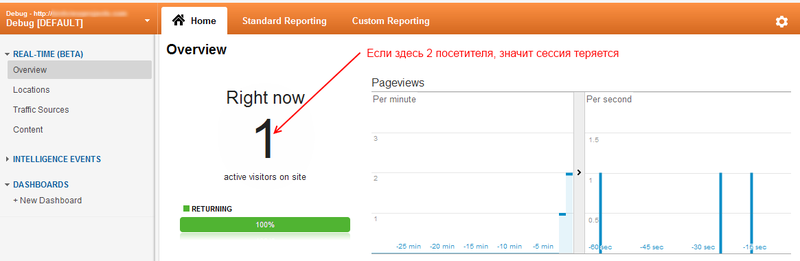
In order to save time on debugging, the Real-time feature was used, which is still in the beta stage. Nevertheless, it works :) For debug a separate resource was added to the account, and the result of the changes was immediately visible:
Not counting the little things, that's all.
There remains one problem that has not yet been overcome. Visitors flow stubbornly records visits to the root page, although PageView hits with a blank URL do not occur. Most likely this is how an account registration event is recorded. Event also refers to a certain page, and since we have a SPA, all Events automatically belong to the root page. We could not find a way to forcefully register a page for Event via the client API.
It seems more strange for users to leave this root page - i.e. as if the account registration event has arrived, but the pageview of the initial page is not. You can of course assume that the user quickly closes the browser at the right time, but the percentage of such exits is quite large. I do not think that many users have such a good reaction and intuition (after all, you need to guess the moment). The problem has not yet been investigated in detail - it doesn’t interfere with living very much.
More from what was noted - the data in the Visitors flow report get a little later than in other reports, so the number of visits in this report is slightly less than in others.
Also sometimes in this report there is a mysterious grouping of pages - at some iteration step there may be one group in which, say, 8 pages. Why these pages are not shown separately (there is a place on the screen) - Google alone knows.
As a result, we got something like the following:
The interpretation of this is a topic for a separate article, and maybe not for one.
Before performing this task, I was very remotely aware of what Google Analytics is and why it is eaten. For this reason, I also want to talk about how I understood Google Analytics, killing many hours of time. I hope this squeeze will help those who are starting to get acquainted with this analytics system.
The task itself is also a bit non-standard, and the experience of “crossing a hedgehog with a snake” can be useful to someone.
So,
Purpose of the analysis
The application whose use has been analyzed is a SaaS application for collaboration and project management. The application has the following registration scheme - you can create an account with one click from the main site, and then you can register this account by giving it a URL and entering the login details. Such a scheme was invented so that potential customers could familiarize themselves with the system without entering any data - i.e. we do not shun lazy and paranoid as clients.
It is clear that such a single-click account (we call it anonymous) has its limitations, the most significant of which is the lack of a dedicated URL (identification is carried out using cookies). As a result, only one user can work in such an account, and while others can be created, they will not be able to log in.
If someone wants to get acquainted with the system more closely, he is offered to register an account. When registering, the URL and e-mail with a password to enter the system is indicated. It is also proposed to choose the estimated tariff plan or free single-user plan.
The task was to find out the reasons why people left the anonymous accounts without registering. These data are supposed to be used to improve the percentage of registrations.
Why choose Google Analytics
Immediately make a reservation - when solving this problem, it was supposed to use "non-invasive" diagnostic methods All logout questionnaires were excluded.
Since we had no experience in solving such problems, the first idea that came to mind was to somehow record the work of users (ideally, to record video). By this record, you can try to understand what users are doing and why they are not registered.
Google showed us on Clicktale . According to the description, everything looks very nice: a certain javascript code is inserted, and all user actions begin to be recorded - mouse movements, clicks, and keyboard input.
The system allows you to build heatmaps (intensity maps of click distribution or mouse movements over pages - averaged over a bunch of users), build many different statistical graphs, and most importantly, play videos of specific visits!
But on closer inspection it turned out that not everything is so smooth. The system works as follows - coordinates of movements and clicks, and events of pressing on the keyboard are recorded. Then our site opens in the IFRAME and the recorded events are played back. However, this is not fundamentally supported by AjAX in general, although for the sake of fairness it must be said that the guys are working on this and are releasing plug-ins for typical AJAX-implementations.
In other words, the system is well suited for static sites. To fasten it to the web-application, especially SPA, it takes a lot of time and files.
We looked in the direction of commercial analytics systems - Totango , mixpanel , but they (logically) turned out to be sharpened specifically for site analytics - calculating all kinds of raits and efficiencies, but not analyzing application usage.
There were even crazy thoughts “to make something of their own”, however, we saw an interesting online utility for visualizing the paths of GAVisual users pulling data from Google Analytics, and realized that in this form it would be nice to see the data. This is not a video of the work of users, but at least the sequence of actions and place of care can be clearly seen. You do not need to manually shovel tens and hundreds of sessions. In the future, a similar feature appeared in the very interface of Google Analytics called Visitors Flow.
And, probably, the deciding factor was that Google Analytics was already bolted to the application.
')
General required principles of Google Analytics
Here, without pretending to anything, I will try to talk about how I understood Google Analytics in relation to our task. I say “applied” because the initial use of Google Analytics is to obtain statistical information about site visits and the “effectiveness of various marketing activities” ( quote ). In other words, the analysis of users' behavior on the site as the purpose of using Google Analytics is not considered, but is only a consequence of the universality of the platform. Further, the system is sharpened primarily for sites and not for applications. Below, I will tell you in more detail about what rakes came from this and how we stepped on them, but so far about the Google Analytics system itself.
For those who want to deal with analytics in general and Google Analytics in more detail, there are a lot of materials, for example, excellent articles at the beginning of a blog on web-analytics .
On concepts:
Hit (please do not find fault with the name) - a single request from the client browser with a loaded site / application to the statistics server. Hits are (mostly) of two types - PageView and Event. The first means that the client opened a certain page, the second - that something happened that was not connected with the opening of the page.
In the examples about the Event is often used "started playing the video," but it can be absolutely everything - moving the mouse, clicks, keyboard input, even the events on the timer.
The only way to trigger an event is to directly access GA using the API, while in order to track the PageView, it’s enough just to have the GA code on the page (it sends a hit itself after the page loads).
Interestingly, in GA, a hit is executed by a GET request to a GIF file, although it may seem logical to make a request to a web service. As far as I know, this is done for the sake of reducing traffic. It also affects the fact that no data should be received from the server. The hit transmits a lot of information - the visitor's ID and session, the URL of the page being opened, the name of the Event, the screen resolution, etc.
Visitor (Visitor) - a unique client who has visited the site. It is determined using cookies.
Visit (Seen) - a sequence of actions (= hits) of a certain client. Ends when the browser is closed or the 30-minute inactivity period expires. It is also tracked using cookies. As a programmer, it's easier for me to call this a “session.”
Those. Google Analytics, using its script, collects actions, sending hits to the server, and there it groups actions by visitors and by sessions.
Now how this data is presented in the Google Analytics interface
Account (Account) - is associated with google-account store hits. In one google-account there can be several analytics accounts. Different accounts, even within the same google-account, are completely isolated from each other. Within the account, users who have access to it are specified, filters that can be applied to the data (but which are not yet applied), and some other settings.
Web property - The top level of data accumulation in Google Analytics. Each resource has its own unique code that fits into the client script and is sent further along with each hit.
Profile (Profile) - a subset of data within a single resource. Each resource has at least one profile; In profiles, you can specify filters by which data is selected. It is important that the profiles are not built dynamically according to the resource. For example, if you create a new profile, the data collected before the profile is created will not appear in it.
Profile - the main "work unit". All statistics are calculated and all reports are built within one profile.
Advanced segment - a subset of data within a profile defined by filters. Unlike profiles, segments are built at once according to all profile data. Also, the data of different segments can be compared with each other (data of different profiles is impossible).
It's a shame that in the segments you can not filter on all fields. So, we wanted to kick off test traffic from the office, spoiling the statistics. I had to do it through the profile, and as a result, the previously collected data could not be “cleaned up”.
Based on the collected data, various indicators are calculated - the number of visitors per day / month / ..., the number of visits per day / month / ..., the ratio of new and returning visitors, the average time to view a page / stay on the site, the percentage of session completion on a specific page and many, many others.
In this form, statistics are of little use, since she knows nothing about our goals. Goals in Google Analytics can be specified as a page to be reached, as the minimum time spent on the site, the number of open pages per visit, or a fixed event. There are also “channel groups” that allow you to track the sequence of actions, but this is already aerobatics.
The main conclusion I made is that this analyst is good when you know exactly what you want from it :) We didn’t have that understanding, so we decided to just watch what the visitors are doing in the application using the report “Visitors flow”. Well, refer to the basic statistics, if you suddenly understand how to interpret it.
How was it done
The very first problem we encountered was the following. The main “unit” of analysis in Google Analytics is the site page. Naturally, we have no pages in the application as such.
Fortunately, the application simply enough managed to allocate the analog page. I do not know how to give it a normal definition, but in most cases it was either a list of objects of a particular type in a particular form, or a screen with detailed information about a particular object. I suspect that something like this can be distinguished in any application.
To even greater happiness, the pages found a one-to-one correspondence in the client architecture of the application. Tracking the opening of the pages was just a matter of technology - the right code with an appeal to API GA in the right place (the only one!), And everything is ready. It was done once upon a time.
There should be a retreat. Initially, statistics were fastened "just in case", without any specific goals. And the very first rake on which we stepped on was that the menus and sidebars in the system were built on the basis of the same object as the pages. That is, when the system was loaded, the analytics code honestly sent three hits - in addition to the main page, they also opened the menu and sidebar. They reached Google for a race - you can imagine what it looked like in the Visitors flow:
In addition to porridge at the beginning of visits, we received almost zero percent of failures. A refusal is to visit only one page in a session, and we have “opened” three at once.
To remove the parasitic calls from the labor code was not made, although they did not return the months of the previously collected statistics.
Then it turned out that the application sent hits almost every time a user clicked. And these hits were Event type. Logically, do not send PageView. Despite the fact that the Events were more or less structured (there are three levels of hierarchy: category, action and label), all the Events are mixed, and we could not draw any sensible conclusions.
The biggest problem is that the events are not fixed in Visitors Flow, i.e. the sequence of events cannot be restored.
The events were conscientiously cleaned out of the application, leaving only the minimum necessary for the registration statistics.
On the third, instead of the compote, they got the biggest problem - the visitors were not segmented. Returning to the goals - we need to track the behavior of newcomers who have just created an anonymous account. Google Analytics, of course, did not know anything about the sources of hits, and in one heap fell both beginners and experienced, and even those who have already bought. There was no sense to us from this heap.
Custom variables came to the rescue. Speaking primitively, up to 5 “name-value” pairs can be attached to a hit, which can then be used to filter data in Advanced segments. A line was added to the analytics code that sets the value of the variable to the account type (anonymous, trial, or purchased), and Advanced Segment is configured. In addition to the trial and purchased accounts, “returnees” were also rejected:
From the moment, everything was ready for collecting statistics. But our UX specialist put forward another requirement - the behavior of users on the registration page should be monitored in detail. Thankfully, they refused to track mouse movements (the analytics session is not rubber - a maximum of 500 hits), but the focus on the fields, button clicks, and keyboard input were necessary to track.
Events for this were not good - it was necessary to restore the sequence of actions. We decided to use PageView instead of events (forgive us the creators of Google Analytics). That is, the focus in the e-mail input field is as if opening the / register / emailfocus page, typing in the password field in the / register / passwordkeypress page, etc.
Technically, it turned out to be easy to implement this - the client API will allow to simulate the opening of pages, indicating the URL of the page. Moreover, it turned out that the analyst groups the same discoveries going in a row, considering them for one discovery. This has proven useful when tracking keyboard input.
The last requirement was to record the reason for the unsuccessful registration (blank fields, busy URL, etc.). It was done quite simply - a validation summary was added to the URL of the virtual page “opened” during unsuccessful registration. Received “open” pages of the register / submitinvalid / aliasistaken type.
After running the code and getting the first statistics, we were disappointed. Separately, the lost time was disappointing - the data in Analytics appears with a delay of several hours, so usually the result of changes is visible only the next day.
Actually the disappointment was that the path to the registration page and on the page itself was recorded as various visits. The reason for this was the implementation of the registration page - it was in a separate application displayed in the IFRAME (the reasons for this are not technical, but organizational, it was easier to divide the work). IFRAME displayed URLs in another subdomain, and analytical cookies, respectively, were not prolazily subdomain.
Google already has a ready-made solution for this situation. I will only note that _setAllowHash was not done, since it was not required to fumble cookies between the main domain and subdomains - only between subdomains.
In order to save time on debugging, the Real-time feature was used, which is still in the beta stage. Nevertheless, it works :) For debug a separate resource was added to the account, and the result of the changes was immediately visible:
Not counting the little things, that's all.
There remains one problem that has not yet been overcome. Visitors flow stubbornly records visits to the root page, although PageView hits with a blank URL do not occur. Most likely this is how an account registration event is recorded. Event also refers to a certain page, and since we have a SPA, all Events automatically belong to the root page. We could not find a way to forcefully register a page for Event via the client API.
It seems more strange for users to leave this root page - i.e. as if the account registration event has arrived, but the pageview of the initial page is not. You can of course assume that the user quickly closes the browser at the right time, but the percentage of such exits is quite large. I do not think that many users have such a good reaction and intuition (after all, you need to guess the moment). The problem has not yet been investigated in detail - it doesn’t interfere with living very much.
More from what was noted - the data in the Visitors flow report get a little later than in other reports, so the number of visits in this report is slightly less than in others.
Also sometimes in this report there is a mysterious grouping of pages - at some iteration step there may be one group in which, say, 8 pages. Why these pages are not shown separately (there is a place on the screen) - Google alone knows.
As a result, we got something like the following:
The interpretation of this is a topic for a separate article, and maybe not for one.
Source: https://habr.com/ru/post/135399/
All Articles