"Weather in the house" or how our office meteorological station is arranged
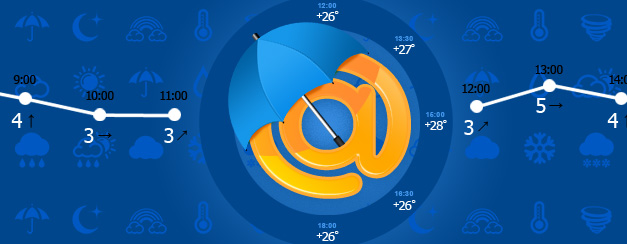
In fact, the idea has been in the air for several years. We fantasized in some detail how we would use the data of our own weather station to correct the weather forecast on the Weather@Mail.Ru service, show the video transmission of weather conditions outside the window and even build a network of weather stations and broadcasts from our users. Well, maybe, once all this will really happen, but for the time being we started small - with everyone who wants to send data from our office meteorological station. How it looks you can see here: pogoda.mail.ru/office . And how it works - read on.
At present, the service is aimed primarily at the company's employees (“what’s behind the window?”, “How to dress?” Is very important, by the way, when you go from the south of Moscow to the office to the north, where the weather is often quite different) residents of the vicinity (who, of course, know where the Mail.Ru Group office is - let me remind you that we are located two minutes from the airport ) and other idle observers (for example, when it howls so convincingly behind the window, I run to see with interest wind power shown by our station). There is another category of observers - visitors to our office, but more on that below.
')
First of all, we chose a hardware weather complex Davis 6162EU Wireless Vantage Pro2 PLUS (cost about 50 thousand rubles) from the company Davis Instruments. Why exactly Davis? I wanted to strike a balance between the completely “home” stations from RST or Oregon Scientific (by the way, a great gift to a friend / colleague who is “addicted” from gadgets) and very deeply professional, for example, Coastal Environmental, which are used by the military and rescuers.
The choice of model is due, in turn, to several other factors: power from the built-in battery (it is recharged from the solar battery), wireless interaction between the external and internal units, and additional sensors. Wireless technology allowed without engineering costs to mount the station in a few hours and virtually eliminate its maintenance. Moreover, if we change the office that will happen in the foreseeable future, we will take it with us.
What our station can measure and show:
In addition, it can calculate the phase of the moon, the time of sunrise and sunset, and also has the function of weather forecasting. The predictive model works quite simple and difficult at the same time, it takes into account the following factors: the coordinates of the location of the complex, the season, the current value of the atmospheric pressure and its change, the speed and direction of the wind, temperature and humidity, the amount of precipitation. As a result, we get a text forecast for the coming hours, for the most part completely justified.
Thus, the station has almost everything that is needed, except that there is not enough automatic detection of the nature of clouds. That's just for these purposes, we thought at one time about the video complex, but so far we have decided to limit ourselves to a pragmatic look behind the window.
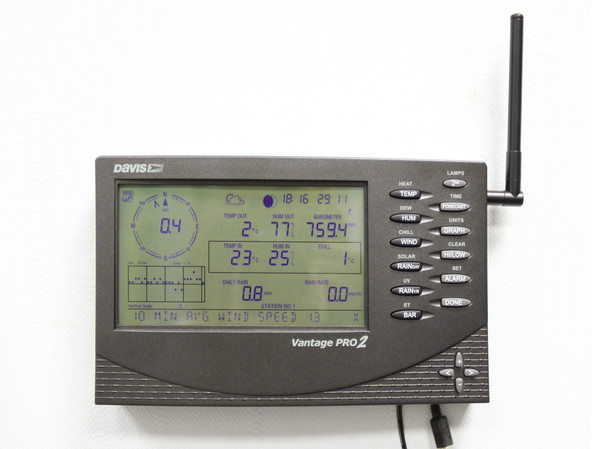
So, in one sunny, hot summer day we installed the external unit of the weather station on the roof of our office, and the internal one - in the server room, on the floor below. Since we immediately aimed at using data on the web, we neglected the availability of the indoor unit (oh, the real weather control panel!) And placed it next to the server. Yes, at the same time, on the one hand, we lost the function of temperature and humidity control inside the office, on the other hand, we acquired an additional opportunity to monitor the server climate.
As Andrei Mainagashev, the system architect of the project, says, to regularly receive weather data from our station, we had to allocate a separate PC in our office server room, for which WeatherLink software was purchased and installed (cost about 8,000 rubles). The internal unit of the meteorological station communicates with this computer using a special cable that allows you to connect the device’s COM port to the PC’s USB connector. The main condition for obtaining actual data about the “weather outside the window” is the constantly working and appropriately configured WeatherLink application.
We immediately had a question about the form in which this software can provide weather data and how we can transfer it to our web server. Having rummaged in the documentation, we found out that, among other possibilities, this software can create files with weather data based on templates (for example, which turned out to be sufficient) using a flexibly customizable schedule, connect to the Internet (if necessary), and publish these files using the protocol FTP or save locally to disk (including network).
Regarding the format of the template, we decided quickly enough - we decided to use simple and easily readable JSON. Some question arose with the method of transferring the generated files from the internal network of the office, where the PC meteorological station itself is located, to a remote working web server, where the obtained data should be saved, consolidated and provided for beautiful display on the pages of user browsers.
FTP was immediately dropped due to its insecurity. We considered the option of giving these files via HTTP, raising a “Windows” web server for this purpose, but this solution required access from the outside to the internal office network and thus caused logical negative evaluations from security specialists.
As a result, we stopped at the option of generating weather data files on a local disk with their subsequent transfer to a remote web server using the HTTP protocol (using the PUT method). And already the process of analyzing and post-processing and storing the information received was assumed on the server itself. Thus, we got a solution in which all the data we are interested in from the office meteorological station every minute is added to the database of the project Weather@Mail.Ru, and there they are constantly available for display "on the web."
Separately, I would like to say a few words about the task of translating into Russian the texts of the forecasts that the WeatherLink program forms. I had to look inside the program to get a lot of options for constructing English phrases, from which predictions are collected as a result. After that, highlighting the phrases and defining their order to search when building Russian phrases, we managed to achieve a less sane translation.
Initially, we planned to show data from the station on special monitors in the office and give employees access to view this data on the web. Immediately the question arose - how to draw and impose? We decided to focus on a large range of monitor resolutions, to make the picture as functional as possible, friendly and at the same time ascetic enough not to distract the user’s graphics from the data, so it was decided to use vector graphics.
Implemented the idea of Artem Sapegin ( sapegin ), web technologist. To work with vector graphics (SVG) from JavaScript, the Raphaël library is used. It provides a convenient API for all major SVG features. In addition, it works in IE 6-8, emulating SVG using VML.
The "Informer" script consists of three parts: a set of widgets, layouts and the main script that unites all this.
Widgets - minimal interface elements. Both simple, like text or arrows (any vector object, the angle of rotation of which depends on the data), and complex, for example, a histogram (which includes both text and arrows). Each widget can update the data and design. And the one and the other happens with the animation. If you watch the page for a while, you can see how the hand of the clock moves. And if you stock up with a thermos of coffee and sandwiches, you can even wait for the change of day and night.
The layout is a hefty description of all types of widgets, their links to incoming data, their design, themes used (day and night), etc.
Not without difficulty, of course. For example, Raphaël does not allow you to fully control the transparency of the gradients, so the gradient on the translucent background “dog” is added by manually changing the properties of the SVG node created by the rafael.
Another difficulty is the upper die for the entire width of the screen. After several experiments, I found a very simple way to draw it: the plate is shifted to the left and has a width that is obviously more than you might need. That is, it simply “hangs” beyond the boundaries of the SVG object on both sides. However, IE, even the 9th, which supports the real SVG, does not allow to draw something outside the SVG / VML object. Therefore, especially for IE, the plate is made a background image for the body tag.
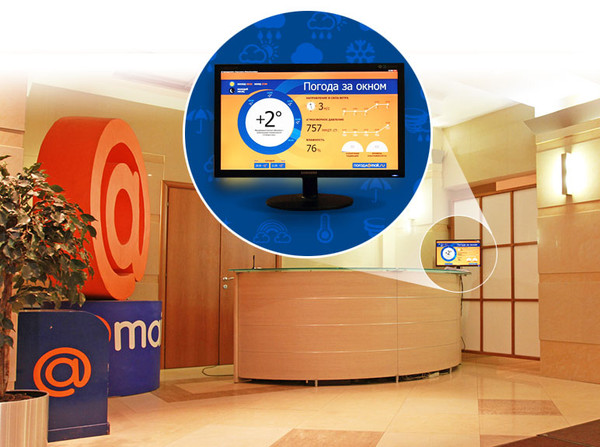
Visitors to our central office in Avion Business Center can see at the reception a special monitor that tells them about the weather, and you, dear readers, right now can see the result here: http://pogoda.mail.ru/office/
Literally the other day, a new version of Weather @ Mail.Ru was launched, where in addition to traditional forecast data for several thousand cities, one more was added - a data slice from our weather station. And let it be so far only Moscow, but Mail.Ru Group has many representative offices in different parts of our country and even abroad. We dream that the stations will appear everywhere in our offices and we will create a full-fledged network of weather stations that will help our users to prepare a little more correctly for traditional weather surprises, which so far no one can foresee for certain.
And ... let it always be summer!
Rozhkov Anatoly,
Director of Media Projects Mail.Ru
At present, the service is aimed primarily at the company's employees (“what’s behind the window?”, “How to dress?” Is very important, by the way, when you go from the south of Moscow to the office to the north, where the weather is often quite different) residents of the vicinity (who, of course, know where the Mail.Ru Group office is - let me remind you that we are located two minutes from the airport ) and other idle observers (for example, when it howls so convincingly behind the window, I run to see with interest wind power shown by our station). There is another category of observers - visitors to our office, but more on that below.
')
We turn to the most interesting - “how it works?”
First of all, we chose a hardware weather complex Davis 6162EU Wireless Vantage Pro2 PLUS (cost about 50 thousand rubles) from the company Davis Instruments. Why exactly Davis? I wanted to strike a balance between the completely “home” stations from RST or Oregon Scientific (by the way, a great gift to a friend / colleague who is “addicted” from gadgets) and very deeply professional, for example, Coastal Environmental, which are used by the military and rescuers.
The choice of model is due, in turn, to several other factors: power from the built-in battery (it is recharged from the solar battery), wireless interaction between the external and internal units, and additional sensors. Wireless technology allowed without engineering costs to mount the station in a few hours and virtually eliminate its maintenance. Moreover, if we change the office that will happen in the foreseeable future, we will take it with us.
What our station can measure and show:
- Atmosphere pressure
- Outdoor and room air temperature
- Outdoor and indoor relative humidity
- Wind speed and direction
- Dew point temperature
- Amount and intensity of precipitation
- Solar intensity
- UV index
In addition, it can calculate the phase of the moon, the time of sunrise and sunset, and also has the function of weather forecasting. The predictive model works quite simple and difficult at the same time, it takes into account the following factors: the coordinates of the location of the complex, the season, the current value of the atmospheric pressure and its change, the speed and direction of the wind, temperature and humidity, the amount of precipitation. As a result, we get a text forecast for the coming hours, for the most part completely justified.
Thus, the station has almost everything that is needed, except that there is not enough automatic detection of the nature of clouds. That's just for these purposes, we thought at one time about the video complex, but so far we have decided to limit ourselves to a pragmatic look behind the window.
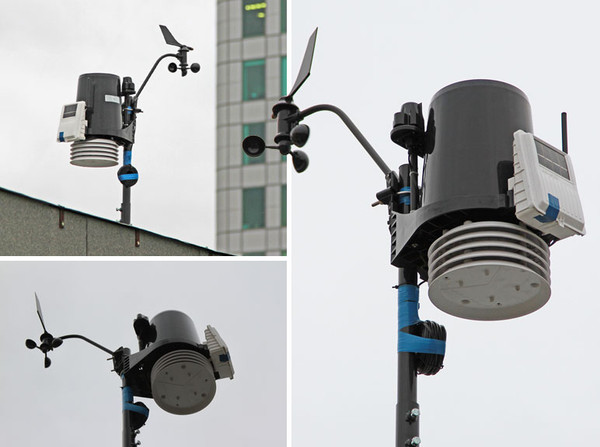
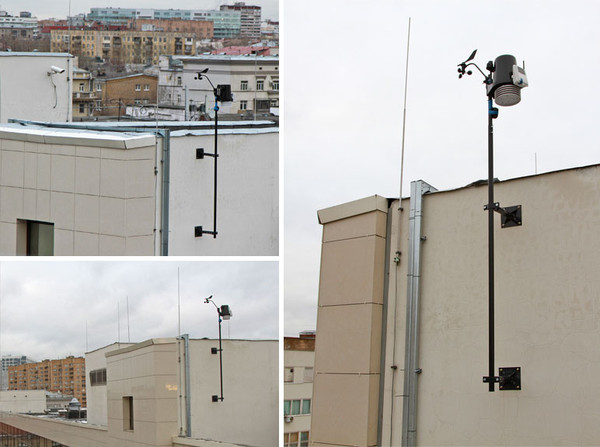
So, in one sunny, hot summer day we installed the external unit of the weather station on the roof of our office, and the internal one - in the server room, on the floor below. Since we immediately aimed at using data on the web, we neglected the availability of the indoor unit (oh, the real weather control panel!) And placed it next to the server. Yes, at the same time, on the one hand, we lost the function of temperature and humidity control inside the office, on the other hand, we acquired an additional opportunity to monitor the server climate.
About the features of the technical implementation of the project
As Andrei Mainagashev, the system architect of the project, says, to regularly receive weather data from our station, we had to allocate a separate PC in our office server room, for which WeatherLink software was purchased and installed (cost about 8,000 rubles). The internal unit of the meteorological station communicates with this computer using a special cable that allows you to connect the device’s COM port to the PC’s USB connector. The main condition for obtaining actual data about the “weather outside the window” is the constantly working and appropriately configured WeatherLink application.
We immediately had a question about the form in which this software can provide weather data and how we can transfer it to our web server. Having rummaged in the documentation, we found out that, among other possibilities, this software can create files with weather data based on templates (for example, which turned out to be sufficient) using a flexibly customizable schedule, connect to the Internet (if necessary), and publish these files using the protocol FTP or save locally to disk (including network).
Regarding the format of the template, we decided quickly enough - we decided to use simple and easily readable JSON. Some question arose with the method of transferring the generated files from the internal network of the office, where the PC meteorological station itself is located, to a remote working web server, where the obtained data should be saved, consolidated and provided for beautiful display on the pages of user browsers.
FTP was immediately dropped due to its insecurity. We considered the option of giving these files via HTTP, raising a “Windows” web server for this purpose, but this solution required access from the outside to the internal office network and thus caused logical negative evaluations from security specialists.
As a result, we stopped at the option of generating weather data files on a local disk with their subsequent transfer to a remote web server using the HTTP protocol (using the PUT method). And already the process of analyzing and post-processing and storing the information received was assumed on the server itself. Thus, we got a solution in which all the data we are interested in from the office meteorological station every minute is added to the database of the project Weather@Mail.Ru, and there they are constantly available for display "on the web."
Separately, I would like to say a few words about the task of translating into Russian the texts of the forecasts that the WeatherLink program forms. I had to look inside the program to get a lot of options for constructing English phrases, from which predictions are collected as a result. After that, highlighting the phrases and defining their order to search when building Russian phrases, we managed to achieve a less sane translation.
Says and shows
Initially, we planned to show data from the station on special monitors in the office and give employees access to view this data on the web. Immediately the question arose - how to draw and impose? We decided to focus on a large range of monitor resolutions, to make the picture as functional as possible, friendly and at the same time ascetic enough not to distract the user’s graphics from the data, so it was decided to use vector graphics.
Implemented the idea of Artem Sapegin ( sapegin ), web technologist. To work with vector graphics (SVG) from JavaScript, the Raphaël library is used. It provides a convenient API for all major SVG features. In addition, it works in IE 6-8, emulating SVG using VML.
The "Informer" script consists of three parts: a set of widgets, layouts and the main script that unites all this.
Widgets - minimal interface elements. Both simple, like text or arrows (any vector object, the angle of rotation of which depends on the data), and complex, for example, a histogram (which includes both text and arrows). Each widget can update the data and design. And the one and the other happens with the animation. If you watch the page for a while, you can see how the hand of the clock moves. And if you stock up with a thermos of coffee and sandwiches, you can even wait for the change of day and night.
The layout is a hefty description of all types of widgets, their links to incoming data, their design, themes used (day and night), etc.
Not without difficulty, of course. For example, Raphaël does not allow you to fully control the transparency of the gradients, so the gradient on the translucent background “dog” is added by manually changing the properties of the SVG node created by the rafael.
Another difficulty is the upper die for the entire width of the screen. After several experiments, I found a very simple way to draw it: the plate is shifted to the left and has a width that is obviously more than you might need. That is, it simply “hangs” beyond the boundaries of the SVG object on both sides. However, IE, even the 9th, which supports the real SVG, does not allow to draw something outside the SVG / VML object. Therefore, especially for IE, the plate is made a background image for the body tag.
What happened?
Visitors to our central office in Avion Business Center can see at the reception a special monitor that tells them about the weather, and you, dear readers, right now can see the result here: http://pogoda.mail.ru/office/
And about the weather
Literally the other day, a new version of Weather @ Mail.Ru was launched, where in addition to traditional forecast data for several thousand cities, one more was added - a data slice from our weather station. And let it be so far only Moscow, but Mail.Ru Group has many representative offices in different parts of our country and even abroad. We dream that the stations will appear everywhere in our offices and we will create a full-fledged network of weather stations that will help our users to prepare a little more correctly for traditional weather surprises, which so far no one can foresee for certain.
And ... let it always be summer!
Rozhkov Anatoly,
Director of Media Projects Mail.Ru
Source: https://habr.com/ru/post/135189/
All Articles