Prediction monitoring, potential crash alerts
This post is a continuation of the previous one . Prediction monitoring is not a standard monitoring method. Therefore, alerts should be used not quite standard. Consider how this is done and why.
What should be the alert
I think everyone wonders who uses which monitoring system in their daily work. We, for example, use Dude . We taught him to monitor the entire infrastructure, except for the most important for us - transit VoIP. The dude is by default able to give alerts by mail and popup when the client application is running. We also taught him to send SMS by an application external to him. But it's not about that.
When an alert comes from the monitoring system, the alert itself must indicate on which of the nodes the failure occurred, and the result of the last measurement of the value being monitored. For example, you may receive a warning that the processor is 95 percent loaded on Router1. In itself, such a notification is informative enough to understand how quickly you need to respond to it. Another thing is when you monitor using the forecast method and at the same time check the status of thousands of parameters.
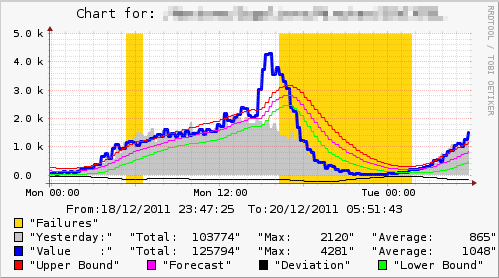
Yes, you can report the result of the last measurement in the alert, you can even display the average result of several recent measurements, or a measurement value that was exactly a day ago. But this often may not be enough. The most effective method of notification in this case is the alert, which displays a graph of the measured value for a certain period of time. A simple glance at a graph is likely to be enough to understand whether a potential failure is critical, and whether it was actually a failure, or whether it is a false positive.
Implementation details in rrdtool
As I wrote in previous posts, in order for rrdtool to begin to predict and identify potential failures - aberrations, it is necessary to correctly form the rrd database and simply fill it with current values. With this configuration, in addition to the values of the measured value, the base is automatically filled with another value - FAILURES. FAILURES is a simple hash, the index of which is the time (unixtime) at which the measurement was taken. The values on the index show the presence of aberrations of the measured value. It's simple, there was an aberration. FAILURES value is 1, it was not - 0.
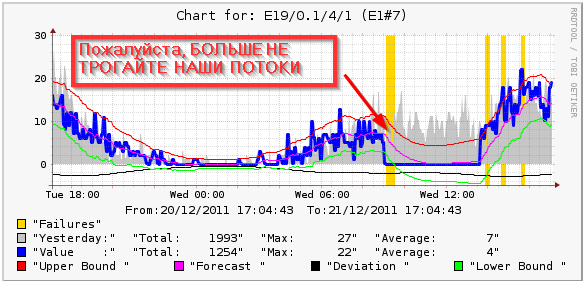
However, simply checking the FAILURES value after the last measurement is not enough. The fact is that aberration can last long enough, take a look at the chart.
Most likely, the monitoring system should not, as long as there is an aberration, give an alert after each measurement of the magnitude. Although, in certain cases, this also needs to be done. In addition, if the aberration is over, this does not mean that the problem is eliminated, it may happen that the system simply adjusts the forecast for new values. The real example in the figure below, the problem with the flow is not solved, and the aberration has already ended.
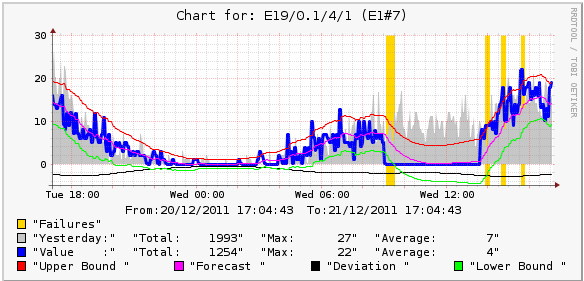
When monitoring an IMHO prediction, the most correct thing is to send an alert with a schedule, at the moments when the aberration started and when it ended.
How it's done
Actually, the script:
#!/usr/bin/env python import os import time import rrdtool import tempfile import smtplib from email.mime.image import MIMEImage from email.mime.multipart import MIMEMultipart COMMASPACE = ', ' # Define params rrdpath = '/usr/rrdmonit/rrd/' pngpath = '/usr/local/share/cacti/rrdmonit/ width = '500' height = '200' mailsender = "alerter@my-domain.com" mailreceip = ["admins@my-domain.com", "support@my-domain.com"] mailserver = 'mx.my-domain.com' # Generate charts for last 48 hours enddate = int(time.mktime(time.localtime())) begdate = enddate - 172800 def send_alert_attached(subject, flist): """ Will send e-mail, attaching png files in the flist. """ msg = MIMEMultipart() msg['Subject'] = subject msg['From'] = mailsender msg['To'] = COMMASPACE.join(mailreceip) for file in flist: png_file = pngpath+file.split('.')[0]+'.png' print png_file fp = open(png_file, 'rb') img = MIMEImage(fp.read()) fp.close() msg.attach(img) mserver = smtplib.SMTP(mailserver) mserver.sendmail(mailsender, mailreceip, msg.as_string()) mserver.quit() def check_aberration(rrdpath,fname): """ This will check for begin and end of aberration in file. Will return: 0 if aberration not found. 1 if aberration begins 2 if aberration ends """ ab_status = 0 rrdfilename = rrdpath+fname info = rrdtool.info(rrdfilename) rrdstep = int(info['step']) lastupdate = info['last_update'] previosupdate = str(lastupdate - rrdstep - 1) graphtmpfile = tempfile.NamedTemporaryFile() # Ready to get FAILURES from rrdfile # will process failures array values for time of 2 last updates values = rrdtool.graph(graphtmpfile.name, 'DEF:f0='+rrdfilename+':val:FAILURES:start='+previosupdate+':end='+str(lastupdate), 'PRINT:f0:MIN:%1.0lf', 'PRINT:f0:MAX:%1.0lf', 'PRINT:f0:LAST:%1.0lf') fmin = int(values[2][0]) fmax = int(values[2][1]) flast = int(values[2][2]) # check if failure value had changed. if (fmin != fmax): if (flast == 1): ab_status = 1 else: ab_status = 2 return ab_status def gen_image(rrdpath, pngpath, fname, width, height, begdate, enddate): """ Generates png file from rrd database: rrdpath - the path where rrd is located pngpath - the path png file should be created in fname - rrd file name, png file will have the same name .png extention width - chart area width height - chart area height begdate - unixtime enddate - unixtime """ # 24 hours before current time, will show on chart using SHIFT option ldaybeg = str(begdate - 86400) ldayend = str(enddate - 86400) # Will show some additional info on chart endd_str = time.strftime("%d/%m/%Y %H:%M:%S",(time.localtime(int(enddate)))).replace(':','\:') begd_str = time.strftime("%d/%m/%Y %H:%M:%S",(time.localtime(int(begdate)))).replace(':','\:') title = 'Chart for: '+fname.split('.')[0] # Files names pngfname = pngpath+fname.split('.')[0]+'.png' rrdfname = rrdpath+fname # Get iformation from rrd file info = rrdtool.info(rrdfname) rrdtype = info['ds[val].type'] # Will use multip variable for calculation of totals, # should be usefull for internet traffic accounting, # or call/minutes count from CDR's. # Do not need logic for DERIVE and ABSOLUTE if rrdtype == 'COUNTER': multip = str(int(enddate) - int(begdate)) else: # if value type is GAUGE should divide time to step value rrdstep = info['step'] multip = str(round((int(enddate) - int(begdate))/int(rrdstep))) # Make png image rrdtool.graph(pngfname, '--width',width,'--height',height, '--start',str(begdate),'--end',str(enddate),'--title='+title, '--lower-limit','0', '--slope-mode', 'COMMENT:From\:'+begd_str+' To\:'+endd_str+'\\c', 'DEF:value='+rrdfname+':val:AVERAGE', 'DEF:pred='+rrdfname+':val:HWPREDICT', 'DEF:dev='+rrdfname+':val:DEVPREDICT', 'DEF:fail='+rrdfname+':val:FAILURES', 'DEF:yvalue='+rrdfname+':val:AVERAGE:start='+ldaybeg+':end='+ldayend, 'SHIFT:yvalue:86400', 'CDEF:upper=pred,dev,2,*,+', 'CDEF:lower=pred,dev,2,*,-', 'CDEF:ndev=dev,-1,*', 'CDEF:tot=value,'+multip+',*', 'CDEF:ytot=yvalue,'+multip+',*', 'TICK:fail#FDD017:1.0:"Failures"\\n', 'AREA:yvalue#C0C0C0:"Yesterday\:"', 'GPRINT:ytot:AVERAGE:"Total\:%8.0lf"', 'GPRINT:yvalue:MAX:"Max\:%8.0lf"', 'GPRINT:yvalue:AVERAGE:"Average\:%8.0lf" \\n', 'LINE3:value#0000ff:"Value \:"', 'GPRINT:tot:AVERAGE:"Total\:%8.0lf"', 'GPRINT:value:MAX:"Max\:%8.0lf"', 'GPRINT:value:AVERAGE:"Average\:%8.0lf" \\n', 'LINE1:upper#ff0000:"Upper Bound "', 'LINE1:pred#ff00FF:"Forecast "', 'LINE1:ndev#000000:"Deviation "', 'LINE1:lower#00FF00:"Lower Bound "') # List of new aberrations begin_ab = [] # List of gone aberrations end_ab = [] # List files and generate charts for fname in os.listdir(rrdpath): gen_image(rrdpath, pngpath, fname, width, height, begdate, enddate) # Now check files for beiaberrations for fname in os.listdir(rrdpath): ab_status = check_aberration(rrdpath,fname) if ab_status == 1: begin_ab.append(fname) if ab_status == 2: end_ab.append(fname) if len(begin_ab) > 0: send_alert_attached('New aberrations detected',begin_ab) if len(end_ab) > 0: send_alert_attached('Abberations gone',end_ab) These are modifications to the script given in the previous post, simply added procedures for checking for aberration and sending mail.
')
PS I do not get tired of being amazed at the capacity and beauty of solutions in the python.
Source: https://habr.com/ru/post/135086/
All Articles