Highstock based dynamic graphics
Hello. I represent one of the leading dance online radio stations in Russia - FreshBeat Radio .
We, like Internet radio, have one huge advantage over FM broadcasting. We do not need to conduct expensive market research to find out the number of listeners, their location, duration and frequency of listening.
We constantly have access to a huge amount of statistical data that can and should be used in order to further match our target audience. Before analyzing the data by listeners, they need to be collected and systematized so that it is convenient to work with them.
')
In this article, I will tell you how to visualize it and periodically update it with the help of Highstock. On Habrahabr, there have already been several articles about this set of tools, but they all described working only with static data.
In our case, all the necessary information is processed by the php script, which parses the standard icecast page with all the necessary data and forms an array of values (for each of the audio streams, you need to get a number of listeners).
Because we are only interested in the value on the Y axis, we have chosen the simplest simple format that Highstock accepts. For dynamic graphics, it is meaningless to transmit the value of X, since we use the current time as the value for the new point.
At the output of the php script, we get the data in JSON format:
Immediately after loading the page you need to get data and set up a schedule. We send ajax request, in the callback function we create a series of points (graphics) for each stream. Each of them is filled with the first point, and we hide all graphs, except for the total (the sum of all streams). As the value of X, we set the current time in the Unix timestamp format.
After that we create and customize graphs based on the data obtained. Basically, these settings hide extra items. I will show only the main ones:
We form a hint view when hovering over a point on the graph. Hide everything except the time and number of listeners. We slightly increase the text.
Also format the zoom graph selector. Years and months are not needed, we leave only 3 periods, the maximum is 15 minutes.
To switch charts necessarily need a legend. In the settings indicate the position, orientation and indents between the elements.
In Highstock there is the possibility of exporting to a picture or printing graphs. We leave only the printing and export in png:
Finally, the most important thing. Specify the function that will add points, and set its call interval in milliseconds. The graphics are updated very quickly, even though every 50 ms. Immediately specify the name of the div, in which the graphics will be displayed.
This function sends the same ajax request as in the initialization of the graphs. The parameters for the addPoint method are the current time and the number of listeners for each stream. If it is necessary to shift the graph after reaching a certain number of points, then change the last value in the addPoint method to true.
To display the graphics on the html page, we connect our js script, jquery, highstock itself and the export module to it. Well, create a div with id equal to the one that was specified when setting up the schedule.
The schedule was updated in about an hour:
Several charts:
Highstock is a very powerful thing, but rather capricious. For example, the latest version 1.1.0 does not work correctly in chrome, even on the official site. Therefore, in my project, I still use version 1.0.2. Also, regardless of the version, there may be problems with the transfer of a large array of objects, the graphics may simply not be built.
We, like Internet radio, have one huge advantage over FM broadcasting. We do not need to conduct expensive market research to find out the number of listeners, their location, duration and frequency of listening.
We constantly have access to a huge amount of statistical data that can and should be used in order to further match our target audience. Before analyzing the data by listeners, they need to be collected and systematized so that it is convenient to work with them.
')
In this article, I will tell you how to visualize it and periodically update it with the help of Highstock. On Habrahabr, there have already been several articles about this set of tools, but they all described working only with static data.
Data collection
In our case, all the necessary information is processed by the php script, which parses the standard icecast page with all the necessary data and forms an array of values (for each of the audio streams, you need to get a number of listeners).
Because we are only interested in the value on the Y axis, we have chosen the simplest simple format that Highstock accepts. For dynamic graphics, it is meaningless to transmit the value of X, since we use the current time as the value for the new point.
At the output of the php script, we get the data in JSON format:
[214,2,13,2,35,0,0,65,97] Data retrieval
Immediately after loading the page you need to get data and set up a schedule. We send ajax request, in the callback function we create a series of points (graphics) for each stream. Each of them is filled with the first point, and we hide all graphs, except for the total (the sum of all streams). As the value of X, we set the current time in the Unix timestamp format.
var seriesOptions=[], data=[], chart; $(function() { $.getJSON('protected/live_values.php', function(lst) { time = (new Date()).getTime()+14400000; // (utc+4) // data.push({x:time, y:lst[0]}); seriesOptions[0] = { name: '/all', data: data }; data=[]; // , for (i=1; i<9; i++) { data.push({x:time, y:lst[i]}); seriesOptions[i] = { name: 'series '+i, data: data, visible: false }; data=[]; }; createChart(); }); }); Plotting
After that we create and customize graphs based on the data obtained. Basically, these settings hide extra items. I will show only the main ones:
function createChart() { chart = new Highcharts.StockChart({ series: seriesOptions, // title: {text: 'Live Statistics Viewer v0.8'}, // 30 xAxis: {maxZoom: 30000}, // plotOptions: {line: {step: true}}, We form a hint view when hovering over a point on the graph. Hide everything except the time and number of listeners. We slightly increase the text.
tooltip: { yDecimals: 0, xDateFormat: '%H:%M:%S', headerFormat: '<span style="font-size: 12px">{point.key}</span>', pointFormat: '<span style="color:{series.color}">{series.name}</span>: <b>{point.y}</b>' }, Also format the zoom graph selector. Years and months are not needed, we leave only 3 periods, the maximum is 15 minutes.
rangeSelector: { buttons: [ {type: 'minute', count: 1, text: '1m'}, {type: 'minute', count: 5, text: '5m'}, {type: 'minute', count: 15, text: '15m'}, {type: 'all', text: 'All'} ], selected: 0 }, To switch charts necessarily need a legend. In the settings indicate the position, orientation and indents between the elements.
legend: { enabled: true, layout: 'vertical', align: 'right', verticalAlign: 'top', x: -10, y: 60, itemStyle: {padding: '10px'} }, In Highstock there is the possibility of exporting to a picture or printing graphs. We leave only the printing and export in png:
exporting: { type: 'image/png', buttons: { exportButton: { menuItems: null, onclick: function() { this.exportChart(); } } } } Dynamic point addition
Finally, the most important thing. Specify the function that will add points, and set its call interval in milliseconds. The graphics are updated very quickly, even though every 50 ms. Immediately specify the name of the div, in which the graphics will be displayed.
chart: { renderTo: 'containerlive', zoomType: 'x', events: { load: function() { setInterval(load, 50); } } } }); }; This function sends the same ajax request as in the initialization of the graphs. The parameters for the addPoint method are the current time and the number of listeners for each stream. If it is necessary to shift the graph after reaching a certain number of points, then change the last value in the addPoint method to true.
function load() { $.getJSON('protected/live_values.php', function(lst) { x = (new Date()).getTime()+14400000; for (i=0; i<9; i++) chart.series[i].addPoint([x, lst[i]], true, false); }); }; That's all
To display the graphics on the html page, we connect our js script, jquery, highstock itself and the export module to it. Well, create a div with id equal to the one that was specified when setting up the schedule.
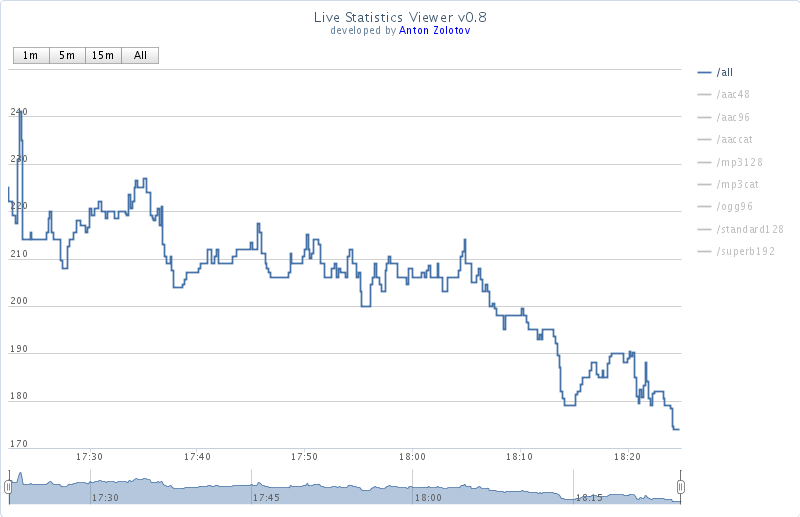
Result
The schedule was updated in about an hour:
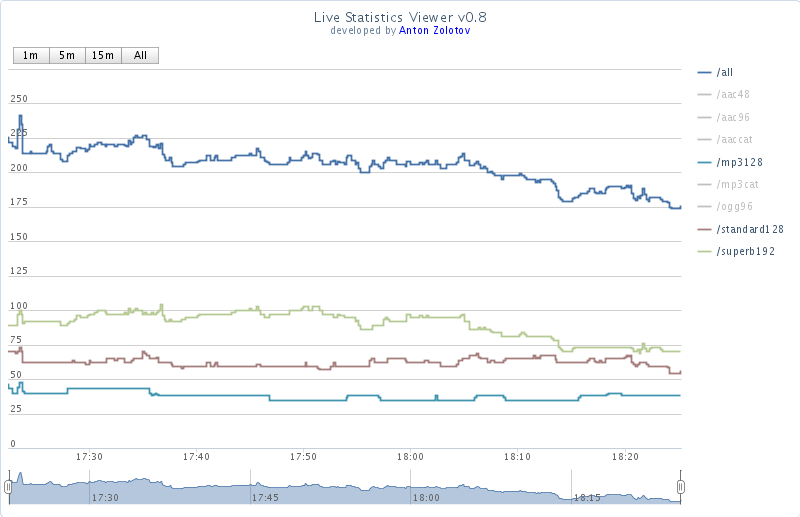
Several charts:
Highstock is a very powerful thing, but rather capricious. For example, the latest version 1.1.0 does not work correctly in chrome, even on the official site. Therefore, in my project, I still use version 1.0.2. Also, regardless of the version, there may be problems with the transfer of a large array of objects, the graphics may simply not be built.
Source: https://habr.com/ru/post/135039/
All Articles