Home accounting from the portal FINANCE.UA
 Today we will discuss another project of the portal FINANCE.UA - the online system for home accounting “ Home Finances - Home.Finance.Ua ” and the open API “Home Finances”.
Structurally, home accounting in Home Finances can be divided into accounting , planning and analysis . Under the cut, I'll tell you more about it.
Accounting
All financial transactions in Home Finances are simplified to expenditures , revenues (which determine the exchange of budget money with the outside world) and transfers on accounts (intra-budgetary movement of money). These three simple and intuitive operations make it easy to describe any financial leash: taking a loan, borrowing money for a short or long term, currency exchange, putting off savings, returning money for goods returned to the store, reimbursement of service expenses, etc. Particularly different options for accounting for debts ) are described here .
')
You can enter another transaction directly or via SMS by sending a text message compiled according to certain rules to the usual (in the sense of charging SMS messages) MTS number. Some time ago, one of our users wrote a small Android application in which you can conveniently create and store operations and then send to the server a message compiled automatically.
Planning
Planning in Home Finances consists of three different ... "plans".
You can plan each individual financial transaction . You can enter the previously known operations of the coming month and then, as the corresponding date arrives, simply “confirm” them. Thus, the “planned” operation will turn into a “perfect” one and will start to go through all the financial statements. If not, then it will become “overdue” and will hang in the eye before deletion or confirmation. Maniacs who like to create many “scheduled” operations ahead of time can use cloning operations with an indication of the periodicity algorithm (every weekday, every weekend; the same day of every week, month).
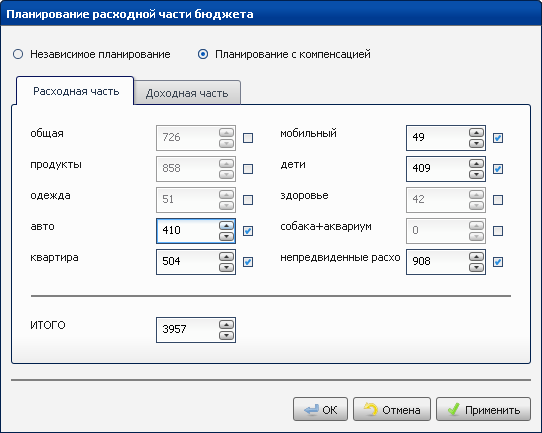
Budget planning is the second type of planning. It consists in setting planned values for each category of expenditure and income. For those who are just starting to plan it is convenient to start with some conditional values. And those who notice patterns from month to month can use “Planning with compensation” - this is an opportunity to change the plan in one category, either due to a reverse change of plans for other (all or specified) categories, or due to a change in the total amount of planned expenses or revenues .
Financial goals - the last type of planning, it allows you to plan balances. To accumulate money for a vacation, an expensive purchase, simply to set aside a certain amount in savings by the due date is a financial goal, so to speak, to have money in a certain amount, i.e. Get the balance.
Analysis
To analyze your financial condition, monitor key financial indicators in Home Finances, there are a lot of financial reports.
The most common and opening upon entering the system is the “Results of the Reporting Period” report. Here you can create your own widgets to display indicators of interest to the user: the amount of expenses (income) for the given categories, the amount of balances on the specified accounts. If you choose the right financial indicators for yourself, this report will be sufficient in most cases to work with the system.

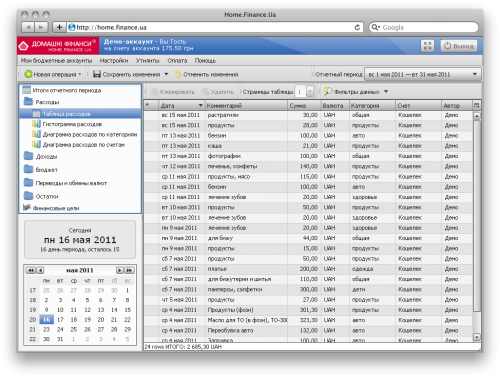
The "Expenditure Chart" shows all transactions for the active budget period. It can be sorted by any column, edited in cells, the total amount of the listed operations is displayed in the table footer.
The Histogram Spending by Day / Period displays the expenditure amounts for the respective days. If you have planned and / or overdue operations, their amounts will be visible on this histogram in a different color.

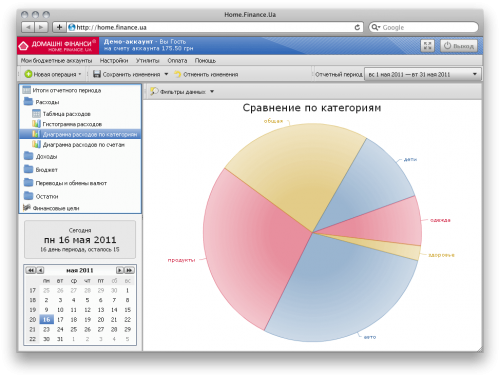
Pie charts “Expenses by category” and “Expenses by accounts” allow you to compare expenses by different categories or from different accounts.
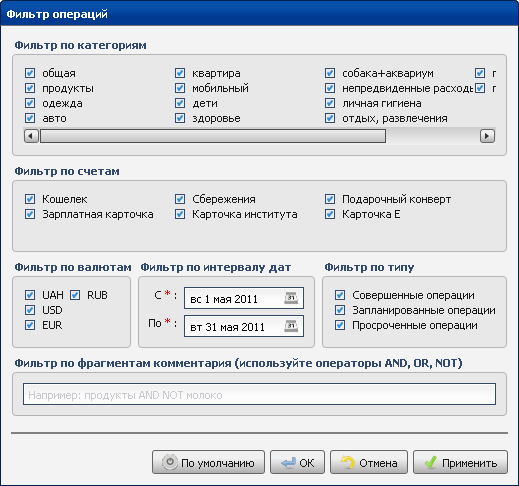
It is worth noting the wide possibilities of filtering operations. You can filter the studied set of active period operations by categories, accounts, currency, date, type or comment fragment. In this case, both in the table and in the diagrams, you will see reports compiled only on the operations selected by the filter. For example, in the histogram, you can get the expenditures by day only in the category Transport, or in a pie chart you can only compare expenses in two categories: Products and Entertainment.
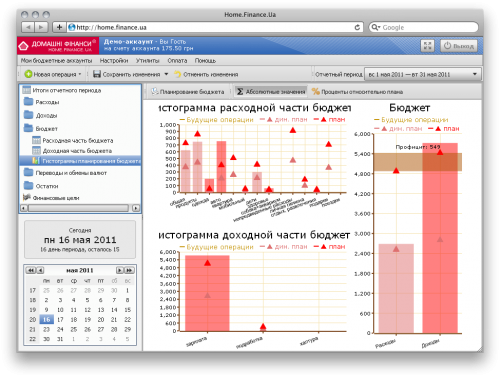
To monitor the implementation of the expenditure and income budgets, two tabular reports and one graphical report are used (on it you will see planned and actual amounts for individual categories of expenditures and revenues, as well as in general plans and facts of expenditure and revenue parts of the budget).
The complex chart “Dynamics of balances by days / periods” shows a linear graph of changes in balances on accounts as well as the amount of expenses-deductions and incomes-accruals on accounts. You can select accounts for analysis and currency of balances you are interested in. In addition, you can see the dynamics of changes in balances in all currencies in the equivalent of the main currency of the account (taking into account the real exchange rate of cash currencies on the corresponding dates).

The Financial Targets report shows individual histograms for each financial goal: the percentage of accumulated balance from the planned and the percentage of elapsed time from the allotted.

In Home Finances, there is a so-called multiplayer - the ability to conduct one user several independent budgets and the access of several users to one budget account with different levels of rights. Since the system is focused on home bookkeeping, the levels of access rights are quite typical:
- Guest can only view reports.
- The user can watch and make new operations, but without the possibility of editing or deleting them
- An editor is a User who can edit and delete his operations.
- An experienced editor can edit and delete any budget account operations.
- Administrator has access to account settings
Separately, I want to say about the budget grid . In Home Finances, you can use the weekly , monthly (with the choice of the day of the month, which will be considered the day of the beginning of the new budget period) and quarterly budget grids. At the same time, you can change the type of grid at any time (for example, you always work with a “monthly” grid, but you decide to track a certain indicator by quarterly). This does not affect the financial history; all data is restructured on the fly.
In case there is a need to track indicators (dynamics of balances, expenses by categories) not from day to day within one budget period, but from period to period - use the “ All periods ” mode. The corresponding reports are independently converted to the desired time grid.
If you actively use different types of planning, you will need a feature such as “Date of accounting relevance” . This is practically a time machine that allows you to move into the past and the future and see your financial indicators in the form in which they were or will be. Transferred to the future - and got:
- access to “future” budget periods
- all planned operations that are relatively new "today" turned out to be perfect in the past, will pass under financial statements and will be available for any analysis
In addition to such global pieces, there are many small handy features: entering checks , “Notes” , exporting to csv , calculator , etc.
Home Finance system is partially paid . After a trial period of 45 days in length, you can continue to use the entire set of functionality (except for the multiplayer), but with a limit on the number of insertions and the frequency of access to the system. In more detail this moment is described here . I can only say that the fee for work without restrictions is 0.50 UAH per day .
Open API
The Home Finance API provides full access to system user account data via http / https post requests with JSON content. Using the API is free for developers. At the same time, on its basis it is possible to create both free and paid services and applications, which we will definitely announce on our website .
The API gives access to “raw” data: lists of operations, categories of expenses and income, accounts, financial goals, etc. All analytical processing (calculation of residuals, execution of plans, etc.) is assumed on the client side.
In the comments I will try to answer questions and constructive criticism.
Source: https://habr.com/ru/post/134446/
All Articles